Analysis of Global Air Surface Temperature Trends and Cosmic Radiation Fluctuations
This report provides an in-depth analysis of yearly global air surface temperature averages from meteorological stations, comparing current trends to historical data. It discusses various factors influencing climate change, including the recent cooling phase observed since the early 21st century. Additionally, the report explores cosmic radiation flux measurements at different altitudes and latitudes, derived from detailed data during solar activity cycles. The findings aim to evaluate whether the observed temperature changes justify concerns regarding global climate cooling.

Analysis of Global Air Surface Temperature Trends and Cosmic Radiation Fluctuations
E N D
Presentation Transcript
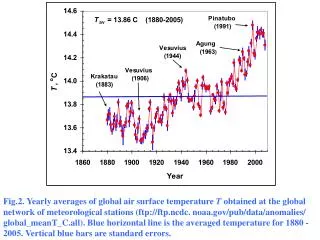
Fig.2.Yearly averages of global air surface temperature T obtained at the global networkof meteorological stations (ftp://ftp.ncdc. noaa.gov/pub/data/anomalies/ global_meanT_C.all).Blue horizontal line is the averaged temperature for 1880 -2005. Vertical blue bars are standard errors.
Fig. 3. Zodiacal dust cloud (yellow color) Jupiter Earth Zodiacal dust cloud Venera Main belt of asteroids
Fig. 4. Global surface air temperature data (red curve) and calculated sum of the spectral lines with the periods of 196, 64, 33, and 21 years (blue curve). Prognosis is shown up to 2050.
Table 2. Spectrum of global temperature, 1880 – 2007 Amplitude Period Phase .2843195.9135 125.0219 .169964.4778 25.2840 .078333.0765 19.3411 .084421.0052 7.6293.0350 8.9727 1.8544 .0433 7.5249 4.7773 .0317 6.4106 5.4168 .0382 5.1916 0.8966 .0255 3.7469 1.9661 .0306 3.6088 1.0313
7. Is prognosis on the cooling climate justified or not? In Fig. 5 the change of ΔT over the globe are shown for the period of 1985 – present time. It is seen that in the beginning of the 21st century the warming process was stopped and during the recent years the climate cooling is observed.
Fig.6. The monthly values of ΔT smoothed with 5 points (red curve). Blue bar shows gradual decrease temperature in the last years.
Fig. 1. A standard radiosonde for measurements of charged particle flux in the atmosphere: 1 – foamed plastic box; 2 – detectors of charged particles (2 gas- discharged counters with an aluminum plate of 7 mm thickness between them); 3 – electronic scheme with high voltage power supply and radio transmitter; 4 – atmospheric pressure sensor; 5 – chemical batteries. 1 2 3 4 5
Count rate of single counter, particles/min Atmospheric pressure x, g/cm2 Fig. 2. Altitudinal profiles of CR fluxes obtained at different latitudes from the equatorial (Rc = 14 GV, bottom curves) to polar ones (Rc = 0.03 GV, upper curves). The measurements were performed in solar activity minimum of 1987.
Fig. 3. Time dependence of the global CR flux in the northern polar atmosphere (Rc =0.6 ГВ )at the altitudes from 25 km (upper red curve) till 12 km (lower orange curve).
Fig. 7a, b. On the left panel (a): altitudinal profiles of CR fluxes J(h) and on the right panel (b): ion production rate q(h). The values of J(h)and q(h) were measured and calculated at the latitudes with different values of Rc (shown near each curve) and correspond to the period of high solar activity level.
Fig. 8a, b. Left panel (a): Altitudinal profilesof light ion concentrations n(h); Right panel (b): Altitudinal profilesofCR fluxes. These data were obtained during solar activity maximum at the latitudes with different values of Rc (figures near curves).
Fig.2. Time dependence of solar activity (Douglas V. Vogt, Kenneth H. Shatten. Group Sunspot Number: A new Solar Activity Reconstruction, Solar Physics, 179, No. 1, pp. 189-219 (1998); http://sidc.oma.be/index.php3).
Fig. 7. Solar activity in 1996 – 2008 (red points), prognosis of solar activity (blue curve- this report, green curve- http://www.swpc.noaa.gov/SolarCycle/index.html).