Dealing with Spatial Autocorrelation
Dealing with Spatial Autocorrelation. Spatial Analysis Seminar Spring 2009. Spatial Autocorrelation Defined.


Dealing with Spatial Autocorrelation
E N D
Presentation Transcript
Dealing with Spatial Autocorrelation Spatial Analysis Seminar Spring 2009
Spatial Autocorrelation Defined • “…the property of random variables taking values, at pairs of locations a certain distance apart, that are more similar (positive autocorrelation) or less similar (negative autocorrelation) than expected for randomly associated pairs of observations.” • Legendre (1993)
Types of Spatial Autocorrelation • Inherent autocorrelation: caused by “contagious biotic processes” vs. • Induced spatial dependence: biological variables of interest are functionally dependent on one or more autocorrelated exogenous variable(s)
Why Should We Care? • “natural systems almost always have autocorrelation in the form of patchiness or gradients…over a wide range of spatial and temporal scales.” • Fortin & Dale (2005) → Autocorrelation is a “fact of life” for ecologists!
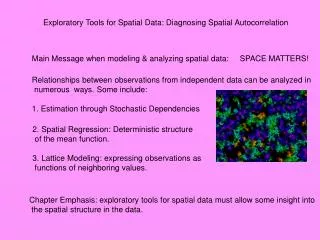
2 Views of Spatial Autocorrelation: • It’s a nuisance that complicates statistical hypothesis testing • It’s functionally important in many ecosystems, so we must revise our theories and models to incorporate spatial structure • Either way, the first step involves describing the autocorrelation (i.e., the “spatial structure”)
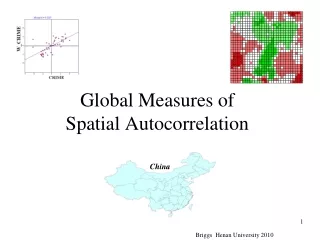
Describing Spatial Autocorrelation • Compute Moran’s I or Geary’s c coefficients over multiple distances • Correlogram: plot distance on X-axis against correlation coefficient on Y-axis • Mantel correlogram: multivariate response • Semi-variogram/variogram
Example Data • Wetland hardwood forest (5 x 5 m cells) • Response variable: log of non-ground lidar points in 0-1 m vertical height bin • n1 = 217, n2 = 68 • Welch’s t-test (unequal variance, unequal sample sizes) results: t = 2.33, df = 181, p-value ≈ 0.021
Now what do I do??? • Adjusting the effective sample size • Spatial statistical modeling methods • Restricted randomization • Other methods: canonical ordination, partial Mantel tests, etc.
Adjusting the Effective Sample Size • Estimate of effective sample size (Fortin & Dale 2005, p. 223, Equation 5.15): • For first-order autocorrelation ρ and large n:
Adjusting the Effective Sample Size • For the “Recently Burned” example data: • For the “Long Unburned” example data: • Welch’s t-test results: t = 1.76, df = 123, • p ≈ 0.080 • BUT, this is a very simplistic model!
Detour: Autocorrelation Models • Model 1 (“spatial independence”): • Model 2 (“first-order autoregressive”): • Model 3 (“induced autoregressive”): • Model 4 (“doubly autoregressive”): SOURCE: Fortin & Dale (2005), pp. 213-216
Detour: Autocorrelation Models • The models on the previous slide were one-dimensional, but most spatial data is two-dimensional (Lat-Long, XY-coordinates, etc.) • The two-dimensional spatial autocorrelation model incorporates W, a “proximity matrix” of neighbor weights, which in turn affects the variance-covariance matrix (C):
Generalized Least Squares (GLS) • Relatively easy way to introduce spatial autocorrelation structure to linear models • Fits a parametric correlation function (exponential, Gaussian, spherical, etc.) directly to the variance-covariance matrix • Assumes normally distributed errors, but errors are allowed to be correlated and/or have unequal variances • Built-in R package: nlme
GLS Model – No Spatial Structure library(nlme) … ## Model A: spatial independence ModelA <- gls(LN_COUNT~BURNED,data=SAC_data) plot(Variogram(ModelA, form=~x+y))
GLS Models with Spatial Structure > ModelB <- gls(LN_COUNT~BURNED,data=SAC_data,corr=corAR1()) > ModelC <- gls(LN_COUNT~BURNED,data=SAC_data,corr=corExp(form=~x+y)) > ModelD <- gls(LN_COUNT~BURNED,data=SAC_data,corr=corGaus(form=~x+y)) > ModelE <- gls(LN_COUNT~BURNED,data=SAC_data,corr=corSpher(form=~x+y)) > AIC(ModelA,ModelB,ModelC,ModelD,ModelE) df AIC ModelA 3 702.1288 ModelB 4 677.3121 ModelC 4 591.7996 ModelD 4 607.3873 ModelE 4 604.7950 > anova(ModelA,ModelC) Model df AIC BIC logLik Test L.Ratio p-value ModelA 1 3 702.1288 713.0652 -348.0644 ModelC 2 4 591.7996 606.3814 -291.8998 1 vs 2 112.3293 <.0001 → Exponential GLS model seems to fit best
Other Autocorrelation Models • Conditional autoregressive (CAR), simultaneous autoregressive (SAR), and moving average (MA) models • See pp. 229-233 of Fortin & Dale (2005) • Implemented in R package spdep, as well as SAM (Spatial Analysis for Macroecology) software • Generalized linear mixed models (GLMMs): R built-in packages MASS, nlme • But wait, there’s more: see Dormann et al. (2007) review paper in Ecography (30) 609-628.
Models and Reality • “Much of the treatment of spatial autocorrelation in the statistical literature is predicated on the simplest AR model, which produces an exponential decline in autocorrelation as a function of distance (Figure 5.16).” • Fortin & Dale (2005, pp. 247-248) • BUT, simple corrections based on first-order AR don’t account for effects of potentially negative autocorrelation at greater distances
Restricted Randomization • PROBLEM: randomization tests based on complete spatial randomness will destroy autocorrelation structure • POTENTIAL SOLUTIONS: • “Toroidal shift” randomization (Figure 5.12) • Contiguity-constrained permutations (see Legendre et al. 1990 for algorithms)
Conclusion • Incorporating spatial structure into ecological models was identified by Legendre as a “new paradigm” in 1993, BUT… • …ecologists are still refining their methods for dealing with spatial autocorrelation • OUR LAST HOPE?: Dale, M.R.T. and M.-J. Fortin. (in press). Spatial Autocorrelation and Statistical Tests: Some Solutions. Journal of Agricultural, Biological, and Environmental Statistics.