Re-Expressing Data
Re-Expressing Data. Get it Straight!. Page 192, #2, 4, 15, 19, 22 Residuals Pg 193, # 11, 23, 27, 33, 45 Pg 195, 16, 22, 23,25,37 Regression Wisdom Pg 214, #1, 3, 4, 8, 10. Goals of Re-Expressing Data. Goal 1.


Re-Expressing Data
E N D
Presentation Transcript
Re-Expressing Data Get it Straight!
Page 192, #2, 4, 15, 19, 22Residuals Pg 193, # 11, 23, 27, 33, 45Pg195, 16, 22, 23,25,37Regression Wisdom Pg214, #1, 3, 4, 8, 10
Goals of Re-Expressing Data Goal 1 • Make the distribution of a variable (as seen in its histogram, for example) more symmetric
Goals of Re-Expressing Data Goal 1 • Make the Spread of several groups (as seen in side by side boxplots) more alike, even if their centers differ
Goals of Re-Expressing Data Goal 1
Goals of Re-expessing Data • Make the form of the scatterplot more nearly linear
Goals of Re-Expressing Data • Make the scatter in a scatterplot spread out evenly rather than thickening at one end. The points in the left scatterplots go from tightly bunched at the left to widely scattered at the right; the plot “thickens.” In the second plot, log Assets vs. log Sales shows a clean, positive, linear association. The variation of each x value is about the same.
The Ladder of Powers • How do you pick which re-expression to use? • We will create (copy) a ladder of re-expression techniques • The farther you move from the 1 position – the original data, the greater is the effect on the data.
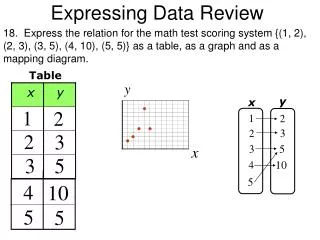
Just Checking You want to model the relationship between the number of birds counted at a nesting site and the temperature (in degrees C). The scatterplot of counts vs. temperature shows an upwardly curving pattern, with some birds spotted at higher temperatures. What transformation, if any, of the bird counts might you start with? • Answer: Counts are often best transformed by using the square root.
Just Checking • You want to model the relationship between prices for various items in Paris and in Hong Kong. The scatterplot of HK prices versus Parisian prices shows a generally straight pattern wit ha small amount of scatter. What transformation, if any, of the Hong Kong prices might you start with? • None, the relationship is already linear.
Just Checking • You want to model the population growth of the US over the past 200 years. The scatterplot shows a strongly upward and curved pattern. What transformation, if any, of the population might you start with? • Even though population values are technically counts you should probably try a stronger transformation like log(population) because populations grow in proportion to their size.
Attack the Logarithms • What do you do if the curvature is more stubborn? • When none of the data values are zero or negative, try taking the logs of both the x and y variables.
Homework Page 239, #3, 5, 8, 11, 13, 15