Download

1 / 9
90 likes | 192 Vues
When a straight line doesn't fit, transform data using various mathematical functions. Learn to use logarithms, reciprocals, or square roots to refine models. Experiment with different functions to enhance accuracy in predicting outcomes. Embrace the trial-and-error nature of finding the most suitable model—remember, perfection is not the goal; adequacy is. Apply these principles with examples on world population data, light intensity, and mortgage amounts at Republic National Bank. Discover how to linearize data and make precise predictions for different scenarios.

E N D
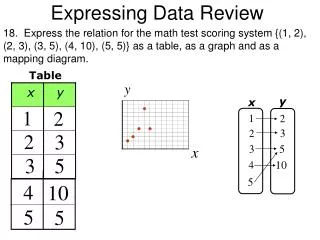
Re-expressing Data Straightening a curved scatterplot
Suppose this happens to you… You make a scatter plot on your calculator and plot the LSRL. It looks like a pretty good fit, and r = 0.997. But then, when you plot the residuals, you get this. Uh-oh, now what do we do???
What do you do when a linear model is NOT appropriate? We transform our data values using mathematical functions to see if they fit better than a straight line. You can take the logarithm of the x values, take the logarithm of the y values, take reciprocals, take square roots, etc. To keep you organized, your textbook gives some guidelines…
Remember… • Finding a good functional model is a guess-and-check process. • There is no such thing as a perfect model. • You are looking for one that is simply good enough… • Let’s try an example…
Linearize the data and make a model for world population… • Enter this data in L1 and L2 and plot the points. What do you notice? • Now try making L3 by using log(L2). • Plot L1 and L3 and now make the LSRL. • What is the predicted population for 2010?
Linearize the data and make a model for light intensity… • Enter this data in L1 and L2 and plot the points. What do you notice? • Now try making L3 by using a function of L2. What should we use? • Plot L1 and L3 and now make the LSRL. • What is the predicted intensity for 12 feet?
Linearize the data and make a model for mortgage amounts at Republic National Bank… • Enter this data in L1 and L2 and plot the points. What do you notice? • Now try making L3 by using a function of L2. What should we use? • Plot L1 and L3 and now make the LSRL. • What is the predicted mortgage level for 1990?