Download
1 / 43
430 likes | 601 Vues
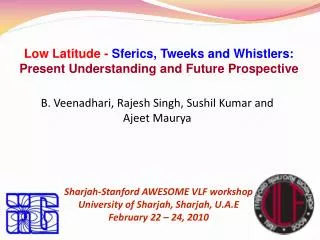
Features of Tweeks observed in Indian Low Latitudes. Rajesh Singh , B. Veenadhari, A.K. Maurya , P. Pant 1 , A.K. Singh 2 Indian Institute of Geomagnetism New Panvel, Navi Mumbai - 410218 India. 1 ARIES, Manora Peak, Nainital – 263129, India

E N D
Features of Tweeks observed in Indian Low Latitudes Rajesh Singh,B. Veenadhari, A.K. Maurya, P. Pant1, A.K. Singh2 Indian Institute of Geomagnetism New Panvel, Navi Mumbai - 410218 India 1ARIES, Manora Peak, Nainital – 263129, India 2Physics Department, B.H.U. , Varanasi – 221005 India
Location of AWESOME sites in India Nainital Lat.20.48N Long.153.34E May, 2007 Allahabad Lat.16.49N Long.155.34E March, 2007 Varanasi Lat. 15.41N Long. 156.37E October, 2007 Stanford University IHY 2007/UNBSSI program
Sources of ELF / VLF waves ELF/VLF waves has various Natural and Artificial origin : • Natural sources of ELF/VLF waves: Includes Lightning discharge from thunder storms , volcanic eruptions , dust storm and tornadoes, etc • Man Made Sources of ELF and VLF Radio Waves: • HF heating • Fixed frequency VLF transmitters • Nuclear explosions • However, on a global basis, by far the most significant source of wave at ELF/VLF is that generated by lightning discharges from thunderstorms. Global Lightning Flash rate ~ 50-100 sec-1 km-2
Propagates in a guided fashion by multiple reflections through wave guide formed by lower boundary of ionosphere and earth surface. This guided propagation occurs with low attenuation rates (a few decibel/1000 km) allowing VLF waves to be observed literally around the world from their source lightning discharge
E-I waveguide boundary conductivity and distance traveled results in appreciable dispersion at lower frequency end Tweeks Dispersion is caused because off wave group velocity becomes very small near the cut-off frequencies due to multiple reflection between D-region ionosphere and Earth’s surface Frequency dispersion analysis of tweeks provide information about ionospheric reflection height, equivalent electron densities and propagation distance in Earth-Ionosphere wave guide
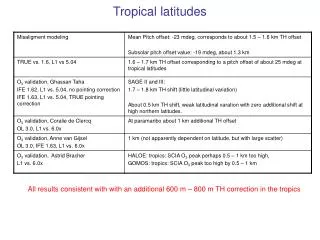
Mode Reflection Height Electron Density Propagation Distance (n) (Km) (el/cc) (Km) 1 95 21.5 7439 2 88 23.3 6824 3 85 24.2 6297 4 83 24.7 5956 Mode Reflection Height Electron Density Propagation Distance (n) (Km) (el/cc) (Km) 1 94 21.7 6751 2 89 23.1 6131 3 83 24.8 5853 Mode Reflection Height Electron Density Propagation Distance (n) (Km) (el/cc) (Km) 1 95 21.5 7690 2 90 22.8 7618
Looking at the application of Tweek atmospherics in the studies of the D-region ionosphere, we decided to start by studying First – Characteristic Features of the tweeks recorded in Indian low latitude region There has been couple of studies from very few selected tweeks observations in Indian region by S. Kumar et al., [1994] and Singh et al., [1992, 1996]. From the analysis of tweeks observed at Bhopal and Varanasi stations in India, the estimated ionospheric reflection height and distance traveled was found to vary in the range of 83-89 km and 1500-2500 km for Bhopal, and 84-94 km and 900-1400 km for Varanasi, respectively.
But a complete study using longer data base of tweeks was lacking in Indian low latitude region. To fill this gap, in this work using large data base we discuss in detail for first time characteristic features of the tweek radio atmospherics observed in Indian low latitude region at Allahabad (Geomag. lat. 16.490 N). Comprehensive analysis of about ~ 3300 tweeks observed over the three month period during March – May, 2007 is done. The quiet location of site and the frequency of tweeks with high harmonics provide good opportunity to study D and E region of the ionosphere in Indian low latitude region.
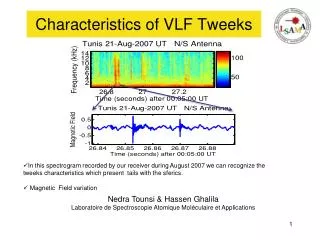
TWEEK EXAMPLES Total of ~3300 Tweeks where analyzed During March-May, 2007
Wave-Guide Mode Propagation A VLF wave propagation relies on the theory of waveguide mode propagation [Budden, 1961]. In electromagnetic waveguide, there are two types of mode, transverse electric (TE) and transverse magnetic (TM) modes. Each mode is associated with its cutoff frequency and there is a one single mode with no cutoff frequency which is called the transverse electromagnetic (TEM) mode. Tweeks are supposed to be excited by vertical current, which occurs in cloud-to-cloud lightning flashes. In an ideal parallel plate waveguide, vertical sources excite only TM and TEM modes [Budden, 1961]. But in real condition the electrical properties of the Earth, the ionosphere and the Earth’s magnetic field causes significant deviation from ideal condition. Because of this pure TM and TE modes can not exist in the earth-ionosphere waveguide.
Instead, the VLF energy is constituted by a superposition of quasi-TM or QTM and quasi-TE or QTE modes. QTM modes are similar to TM modes except that it has a small longitudinal component in the direction of wave propagation. Different modes have different cutoff frequency, for example QTM mode has cutoff frequency ~1.8 kHz and similarly higher order modes have higher cutoff frequency in EIWG. The QTEM mode has no cutoff frequency so this mode travels at approximately with the speed of light with simultaneous arrival of all frequencies. The attenuation of the QTEM mode increase exponentially with frequency and most of the QTEM frequency component are strongly attenuated above ~1.0 kHz, so below first mode cutoff (~1.8kHz) energy is propagated as QTEM mode waves.
Occurrence pattern of tweeks March – May 2007 A total of ~3,300 tweeks analyzed, which showed that tweeks occur only in nighttime (18:00-06:00 LT).
Occurrence pattern of tweeks Generally tweek occurs during whole night but there occurrence percentage is higher in night-time (21:00-3:00 LT). Higher harmonic tweeks occur mostly in this period. Few tweeks especially with 5th and 6th harmonics were found to occur in this period. This is because D-region ionosphere is better reflector at night than during day, and gyrotropy of the ionosphere is strong in night time when D-region is elevated to 80-90 km height Tweeks are easily observed up to 5:00 LT after that their occurrence becomes less, and after 6:00 LT it is difficult to observe tweek. Also the time duration of the tweeks is found in the range of 10-50 ms.
Ionospheric reflection heightand propagation distance from source lightning discharge in EIWG for all the tweeks ~ 3300 analyzed
Tweek Mode Cut-off Mean Reflection Frequency Frequency (fcn/n) Height (n) (kHz) (kHz) (Km) a 1 1.5893 1.5893 94.38 2 3.2321 1.6160 92.81 3 4.8750 1.6250 92.30 4 6.5893 1.6473 91.05 5 8.3036 1.6607 90.32 6 10.0893 1.6815 89.20 b 1 1.6260 1.6260 92.25 2 3.3036 1.6518 90.81 3 5.0893 1.6964 88.42 4 6.8393 1.7098 87.72 5 8.6607 1.7321 86.59 c 1 1.6607 1.6607 90.32 2 3.4107 1.7053 87.95 3 5.2679 1.7557 85.42 4 7.2231 1.8053 82.96 d 1 1.6250 1.6250 92.30 2 3.4107 1.7053 87.95 3 5.3750 1.7783 83.72 e 1 1.6250 1.6250 92.30 2 3.4464 1.7232 87.04
We see that mean frequency for each mode is not same as it should, rather it increases as mode number increases from n = 1-6 and this increase is in step manner. Calculated reflection height for the different tweek shown in the example, varies from ~ 94 to 83 km. This indicates that as mode number increases reflection height decreases, this is because as mode number increase cut-off frequency increases so reflection height decreases. Similar trend is being observed for other examples also. This trend in reflection height indicates that the upper boundary of the EIWG is not sharp medium rather it is diffuses boundary. This explains the well known trend of ionosphere that ionization density slowly increases with height.
Next we also calculated propagation distance for 710 selected tweeks with very clear dispersion. Major part of the tweek analyzed (~46.90 %) has propagation distance in the range of ~ 6000 km, and most tweek (~90%) have propagation distance in the range of 4000-8000 km. This distance range from the observing station Allahabad in India, lies in South-East Asia which is one of the three major regions of lightning activity on globe
To explain why tweeks are mainly observed in the night time? We have calculated attenuation factor for fundamental mode n=1 The curve indicates that the attenuation increases as the frequency approaches cut-off frequency of the EIWG, so waves below this cut-off frequency can not travel, and attenuation also increases when ionospheric reflection height falls. During the daytime attenuation is high and in the nighttime attenuation is less
For the closer look of nighttime ionospheric conditions - Dusk, Night, and Dawn periods attenuations is also calculated Attenuation values is nearly similar for Dusk and Dawn periods And values are much lower for night-time period - this causes higher occurrence of tweek with higher harmonics
Direction Finding for identifying source position of lightning discharge
From the simultaneous observation of Tweeks at Indian station Nainital Geomag. Lat. 20.48N Geomag. Long.153.34E Allahabad Geomag. Lat.16.49N Geomag.Long.155.34E Date: June 13, 2007; Time:15:00:00 – 19:00:00 UT Local Night time: 20:30:00 – 00:30:00 LT Analysis of 526 pairs (1052 total) of tweeks observed simultaneously at both sites during the period
Distance traveled by tweeks from source lightning discharge w.r.t. ALLAHABAD site (Geomag. Lat.16.49N; Geomag. Long.155.34E)
Distance traveled by tweeks from source lightning discharge w.r.t. NAINITAL site (Geomag. Lat.20.48N Geomag. Long.153.34E)
The calculated distance traveled were then used to locate the source position of causative lightning discharge of Tweeks This is fixed by the intersection of two circles drawn by the distance traveled (propagation distance) from Allahabad and Nainital stations. Ohya et al., 55, 627, 2003, Earth Planets Space
The location of the tweek atmospherics were confirmed by looking into Lightning data
SUMMARY Lightning generated tweek atmospherics has the unique advantage of being capable of estimating lower ionosphere heights, electron densities at these heights in a wide area surrounding observation site (~ 1000 – 15000 km) The method is useful for detecting changes in reflection heights, electron density in the D-region ionosphere, which could correspond to abnormal geophysical conditions. Thank you for kind attention !
Theoretical Background • The refractive index of wave propagation in magnetoactive plasma is expressed by famous Appleton-Hartree formula (Budden, 1961): (1) Where nr = Refractive index of the medium ω=Angular frequency of the wave
=Collision frequency of electron with neutrals θ=Angle between the propagation direction of the wave and the external magnetic field vector =Angular plasma frequency =Angular electron gyro frequency Plasma frequency WhereNis the electron density pre cm3 The upper sing “+”in the denominator of equation (1) corresponds to the Ordinary wave and lower sing “-” corresponds to the Extraordinary wave in the magneto active plasma.
The ordinary mode corresponds to the right hand circular polarization and Extra ordinary wave corresponds to left hand circular polarization ( Hayakawa, 1994). the possibility of full reflection for the Extraordinary waves in the lower ionosphere is demonstrated by using the quasi longitudinal approximation [Yedemsky et al.(1992) and Hayakawa et al. (1994)] Applying the quasi longitudinal approximation and excluding the terms proportional to sin2θ ( under the condition sin2θ << 1) in equ. (1). We get the well known expression for refractive index: Taking into accounts the plasma parameters we can neglect the losses (Z<<Y) (Shvets et al,1997)
The expressions for the refractive index of the Extraordinary and Ordinary waves are given respectively as follows: (3) For extraordinary wave (4) For ordinary wave From equation (4) it clear that refractive index for ordinary waves is always positive so this wave can propagate into the ionosphere and will be received as whistler wave . For Extra ordinary wave refractive index decreases as the electron density ( with altitude) increase and it will be zero at some height. the waveundergoes full reflection at this height. With the further increase of height refractive index for the E-waves becomes imaginary so the wave can not propagate into the ionosphere .
The X value where n2r becomes zero is given by following equation X = 1 (5) (6) Equation (5) and (6) represents O-mode and E-mode wave respectively The E-mode wave corresponds to X=1+Y when Y > 1 ( ωH > ω) The E-mode wave corresponds to X=1- Y when Y < 1( ωH < ω ) As in the case of ELF/VLF wave frequency of wave is below the gyro frequency of electron so we use condition first i.e. X=1+Y
The electron density N (el/cm3) at the tweek atmospherics reflection height is derived from : Under the assumptions of collision less plasma and Y >>1 is as follows: [el/cm-3 ] Using the value of ωH=8.4 x 10⁶ s-1 from IGRF model for the low latitude, we have: N=1.66 x 10⁻²fc[el/cm-3 ] (7) Where fc is the waveguide first order cut-off frequency (in Hz) obtained using tweek measurement • Estimation of electron density
The wave source is assumed to be vertical electric dipole located on the ground and excite the QTM and QTEM waveguide modes. which propagates with different phase velocities (cummer, 1997) Each of the mode is characterized by its cut-off frequency fcn except for QTEM mode which has no cut-off frequency . For a waveguide having perfectly conducting boundaries the cut-off frequency of nth mode is given by (Budden, 1961): (8) Where n is mode number, h is height of waveguide and c is speed of light in free space. By accurately measuring cut-off frequency for first order mode fc we can calculate the reflection height (h): (9)
The group velocity υgn for the different modes of propagation is given by (ohtsu, 1960) : (10) The distance d propagated by tweek in the Earth-Ionosphere waveguide is given as : (11) Where dT is the dispersion time of tweeks measured from tweek spectrogram , f is frequency of wave. By accurately measuring the dispersion time dT and cut-off frequency fcn from tweek spectrogram we can estimate distance d of tweek in EIWG from equation (11).
How to measure dispersion time dT ? dT Tweek dT= td - to to td dT = Dispersion time to = Arrival time of tweek before dispersion td = Arrival time of tweek after dispersion
Set of Equations used in present study of D-region ionosphere • Electron density : N=1.66 x 10⁻²fc [el/cm-3 ] 2. Reflection height [km] 3. Distance traveled from source L-D [km]