Download
1 / 14
140 likes | 154 Vues
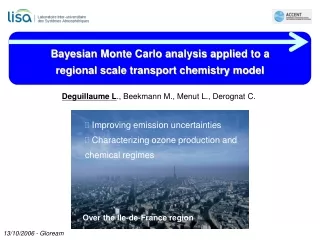
Bayesian Monte Carlo analysis applied to a regional scale transport chemistry model. Deguillaume L ., Beekmann M., Menut L., Derognat C. Improving emission uncertainties Characterizing ozone production and chemical regimes. Over the Ile-de-France region. 13/10/2006 - Gloream. NOx limited.

E N D
Bayesian Monte Carlo analysis applied to a regional scale transport chemistry model Deguillaume L., Beekmann M., Menut L., Derognat C. • Improving emission uncertainties • Characterizing ozone production and chemical regimes Over the Ile-de-France region 13/10/2006 - Gloream
NOx limited CHEMISTRY VOC limited TRANSPORT EMISSIONS Context Photochemical air pollution
Ile-de-France region Airparif Context Modelling those processes Development of a chemistry transport model CHIMERE (IPSL/ INERIS/LISA) • Model domain : 150×150km • Horizontal resolution : 6×6km grid • Vertical resolution : 8 layers in hybrid pressure coordinates • Chemical mechanism : reduced Melchior • Meteorology: ECMWF • Anthropogenic emissions: EMEP, ARIA, AIRPARIF • Biogenic emissions: Simpson et al. (1999)
Problems (1) Uncertainties in emissions is always rather large and difficult to estimate Uncertainties on activity factor, emission factor spatial distribution, temporal variability... (2) Evaluation difficult since emitted pollutants undergo chemical transformation and are tranported away from sources Inverse modelling of emissions from observations (ground based and satellite) Objectives Improving emission uncertainties with a Bayesian approach Application to semi-climatologic (summers 1998+1999) period for generalization Objectives Observation : Simulated concentrations are very sensitive to emissions
Methods : inverse modelling • To verify and improve available estimates of atmospheric pollutants emissions • Alternative to bottom-up construction of emission cadastres • To improve performance of atmospheric models, especially in diagnostic studies • To develop a general observation-based methodology for estimating parameters of the atmosphere that cannot be observed directly • Adjoint model • Kalman filter • Bayesian Monte Carlo analysis
A priori concentrations without constraints A priori uncertainties in emissions Monte Carlo simulations A posteriori distributions of emissions A priori uncertainties of input parameters « Model uncertainties » Weighting by observations Uncertainties in observations Correction on a priori distributions of emissions (also on other perturbed input parameters) (-) Single correction factor over the whole grid domain and time period of the simulations (+) Information on the value but also uncertainty associated to the emissions Principle of the Bayesian Monte Carlo analysis
For each kth Monte Carlo simulation, the agreement function: P(O|Yk) « Probability to observe a vector of observations O given that the model output Yk is the true value for the kth Monte Carlo simulation » Hypothesis: Observations present a normally distributed errors ε N independent observations Oj Each simulation is weighted by P(O|Yk) Cost function Results ? A posteriori probability density function vs. a priori one Cumulative probability density function (CPDFs) (probability that a given model prediction Xk stays below the limit X) Mathematical formulation
Perturbed model input parameters A priori uncertainties of input parameters « Model uncertainties » Log-normal distribution Uncertainty ranges uncertainty assessment studies and expert judgements
(1) Urban NO and O3 NO direct forcing for NOx emissions O3 information on ozone precursor emissions (VOC, NOx) (2) Rural O3 buildup For simulations and observations: The two daily maximal [O3] O3 plume The 3 lowest [O3] O3 background + (1) Days where the maximal [O3] is observed and simulated at the same or neighbouring station (2) [O3 max] - [O3 back] > 10 ppb for simulations and observations Measurement constraints observations PARIS AIRPARIF NETWORK
2σ 2σ 2σ Total constraints Uncertainties are reduced by a factor : 1.7 3.2 2.4 Red Total constraints Results – Cumulative probability Simulated urban NO, O3 and O3 production in the plume- summers 1998 + 1999 2σ 2σ 2σ Blue without constraints Deguillaume et al., in press, JGR, 2006
Total constraints Red lines a posteriori distribution NOx emissions remain nearly unchanged - VOC emissions are enhanced (+16%) 1σ uncertainty : 22 % for NOx , 31% for VOC emissions Better fit the observations in 1999 vs. 1998 (in 1998, the constraints do not act in a similar way) Results – Probability density functions Emissions of anthropogenic NOx and VOC – cumulative summers 1998 and 1999 Blue histogram a priori distribution with 40% 1σ uncertainty
Semi-climatologic period Bayesian Monte Carlo uncertainty analysis Ile-de-France region A posteriori PDF NOx emission unchanged average reduced standard deviation (20% vs. 40%) VOC emission enhancement (+16%) reduced standard deviation (30% vs. 40%) indirect constraints on VOC emissions (urban O3 and O3 production) lower reduction Uncertainty in the simulated urban NO, urban O3 and O3 production in the plume are strongly reduced Adjustements in the other model input parameters (vertical mixing coefficient, 1998) Better fit in 1999 than in 1998 because constraints in 1998 do not act in a similar way Other region ? Marseille area (ESCOMPTE, AIRMAIX network) Satellite measurements Conclusion & perspectives
Perspectives… Better understand the buildup of pollution episodes around Paris region Objectives Characterizing ozone production and chemical regimes Application to semi-climatologic (summers 1998+1999) period for generalization Methodology 2 approaches Bayesian Monte Carlo approach Direct simulation Constraints by observations Emission reduced scenario (-30% NOx and -30% VOC emissions) Analysis of the chemical regime over the Ile de France region
(2) Characterizing ozone production and chemical regimes Preliminary results ... Daily maximum of O3 averaged over summers 1998 and 1999 NOx -30% Reference VOC -30% Anticyclone sur l’ocean mouvement aiguille montre vent vers le sud