Understanding Variables
Understanding Variables. Emily H. Wughalter, Ed.D . Professor, Department of Kinesiology Spring 2010. What is a variable?. Variables are determined by the characteristics they measure and they are defined by the experimenter.

Understanding Variables
E N D
Presentation Transcript
Understanding Variables Emily H. Wughalter, Ed.D. Professor, Department of Kinesiology Spring 2010
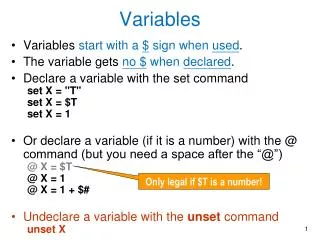
What is a variable? • Variables are determined by the characteristics they measure and they are defined by the experimenter. • To be quantifiable a variable must have a minimum of 2 levels. A 2 level variable means it is dichotomous (binary) and nominal, or the variable can be measured continuously as in a ratio or interval variable.
Types of Variables • Independent and Dependent Variables • Between Subject and Within Subject Variables (repeated measures)
Levels of Measurement • Nominal – no numbers are assigned; categories cannot be ordered; categories; categories must be mutually exclusive • Ordinal – ranking of data; although it appears that the distance between the numbers assigned (ranks) is equal in fact they are not equal; cannot be +, -, X or /.
Interval – the distance between the numbers assigned is equal. Interval scores can be +, -, x, /. There is no true zero point. • Ratio – the distance between adjacent points is equal, but there is a true zero point.
Independent Variables • The independent variable is the variable manipulated by an experimenter. • Examples of independent variables are: • Type of instruction (massed, distributed) • Method of exercise (aerobic, anaerobic, combination) • Marketing strategy (direct, indirect)
Dependent Variable • The dependent variable is the measure of the effect of the independent manipulation. • Some examples of dependent variables are: • Reaction time • VO2 Max • Audience participation • Revenue in dollars
The terms between subject and within subject variables refer to the assignment of treatment conditions to specific groups. • In a between subject variable participants receive one treatment or another but not all. • In a within subject variable the participants receive all treatments.
Counterbalancing • When an independent variable is repeated or within Ss the order of conditions should be counterbalanced. Counterbalancing is done to control for order of treatment effect, and other possible effects (such as: fatigue, boredom, learning, and practice). • Counterbalancing helps a researcher answer the question: does it make a difference if you are in treatment A or B first?
Tests of Relationships • Pearson Correlation (simple correlation between two continuous variables) • Spearman Brown Prophecy Formula • Multiple Correlation or Regression (complex correlation among more than two continuous variables)
Tests of Difference • t-tests • Analysis of Variance
t-tests • A t-test can only be applied when the design has one independent variable with two levels. This is a limiting parameter with regard to the t-test. • Independent Means t-test • Use when the independent variable is a between subjects’ variable • Dependent Means t-test (correlated, paired association) • Use when the independent variable is a within subjects’ variable.
Analysis of Variance (ANOVA) • Analysis of variance can be used when the independent variable has more than 2 levels. • Analysis of variance can be used when more than one independent variable is manipulated.
Understanding Hypotheses • Tests of Relationship (how do two variables covary or relate together?) • Pearson (Variable A will relate to Variable B.) • Spearman (Variable A will relate to Variable B.) • Tests of Difference (what effect/impact does an independent variable have on a dependent variable?) • t-tests • Independent means (Independent variable will not affect dependent variable). • Dependent means (Independent variable will not affect dependent variable.) • ANOVAs (Independent variables will not interact to affect the dependent variable).
Three types of hypotheses • Directional • Null • Alternative
Directional Hypotheses • Directional hypotheses are written to be supported • One tailed • States a particular direction • Most difficult to support • Written when the data reported in the literature are unequivocal about an issue, and when there is strong theoretical support for predicting a particular direction too • The directional hypothesis is supported if p<.05 and the means fall in the correct direction , i.e, the means support the direction stated in the original hypothesis (guess) ; otherwise the directional hypothesis is rejected.
Directional Hypothesis • A teacher hypothesized that practice would affect scores on a fitness test battery, such that a group with training would produce higher fitness scores than a group with no training. • t= 7.45; df= 75 ; p< .01 • M trained= 2.55 (Z score across fitness test battery) • M untrained = .56 (Z score across fitness test battery • t= 7.45; df= 75 ; p< .01 • M trained= .56 (Z score across fitness test battery) • M untrained = 2.55 (Z score across fitness test battery
Null hypothesis • Null hypotheses are written when the literature on an issue is equivocal or when support for a direction cannot be found in the empirical or theoretical literature. • Null hypotheses are written to be rejected • Two tailed test • The null hypothesis can be rejected when findings fall in either direction • Written in the null form, e.g., “no relationship” or “no difference” • If p< .05 then the null hypothesis can be rejected; otherwise if p>.05 then the null hypothesis is accepted.
Null hypothesis • Practice will not affect performance on the fitness test battery. • t=7.45; df=16; p<.01 • M trained= 2.55 (Z score across fitness test battery) • M untrained = .56 (Z score across fitness test battery • t=7.45; df=16; p<.01 • M trained= .55 (Z score across fitness test battery) • M untrained = 1.56 (Z score across fitness test battery • T=.048; df=12; p>.05 • M trained= .55 (Z score across fitness test battery) • M untrained = .56 (Z score across fitness test battery
Alternative • The alternative hypothesis is written in the positive form; however there is no real test of this hypothesis. We will not use.