Download
1 / 52
520 likes | 618 Vues
Discussing the progress towards GIVS goals related to immunization coverage, projected mortality reduction, and the introduction of new vaccines. Analyzing global trends, challenges, and strategies to achieve the desired goals by 2015.

E N D
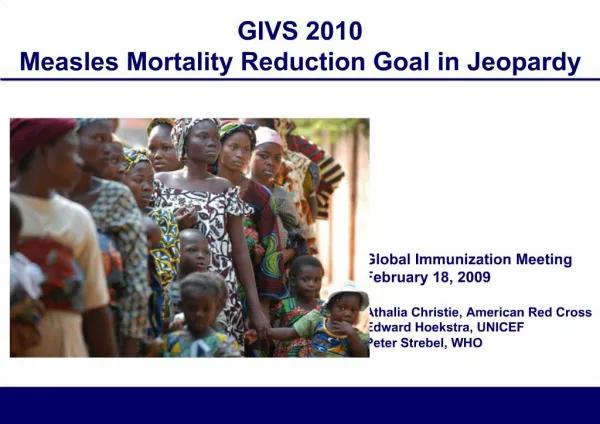
Global Update of the 2010 GIVS Goals Global Immunization Meeting New York, 17-19 Feb 2009 JM Okwo-Bele, WHO P. Salama, UNICEF
Projected Changes in Under-5 yr mortality due to VPDs Preventable with current pace of progress with coverage improvements Preventable if coverage is scaled up to 90%, impact of campaigns and widespread use of new vaccines 60%-70% reduction in rate Not preventable by 2015
Are we on track to achieve the GIVS goals ?1. By 2010 or earlier - Increase coverage
Global DTP3 coverage 1980-2007 and projections 2008-2010 to reach 90% global goal in 2010 Source: WHO/UNICEF coverage estimates 1980-2006, August 2007 193 WHO Member States. Date of slide: 15 February 2008
Countries achieving >=90% DTP3 coverage, 2007 >=90% (117 countries or 61%) <90% (76 countries or 39%) The boundaries and names shown and the designations used on this map do not imply the expression of any opinion whatsoever on the part of the World Health Organization concerning the legal status of any country, territory, city or area or of its authorities, or concerning the delimitation of its frontiers or boundaries. Dotted lines on maps represent approximate border lines for which there may not yet be full agreement. WHO 2008. All rights reserved Source: WHO/UNICEF coverage estimates 1980-2007, August 2008 193 WHO Member States. Date of slide: 12 February t 2008
Countries with all districts achieving at least 80% DTP3 coverage, 2007 Yes (55 countries or 28%) No (96 countries or 50%) No data (42 countries or 22%) The boundaries and names shown and the designations used on this map do not imply the expression of any opinion whatsoever on the part of the World Health Organization concerning the legal status of any country, territory, city or area or of its authorities, or concerning the delimitation of its frontiers or boundaries. Dotted lines on maps represent approximate border lines for which there may not yet be full agreement. WHO 2008. All rights reserved Source: WHO/UNICEF estimates and WHO/IVB database, September 2008 193 WHO Member States.
Countries with most unvaccinated infants DTP3 coverage, 2005-2007 (in millions) Major Concern: Lack of progress to reduce the number of un-reached Source: WHO/UNICEF coverage estimates 1980-2007, August 2008 Date of slide: 21 August 2008
"Return Routine Immunization to the centre stage" (*) • Issues: • Coverage data quality • Political support in 'Lagging' Countries • Cash support • Ways forward: • Return to the basics: Annual Planning & Reviews; training; improved monitoring… • Focus on the un-reached • Support the current momentum for HSS/PHC • Innovative & local solutions tailored to local needs (*) WHO/AFRO Medium Term Review_08)
Are we on track ? 2. By 2010 or earlier – Reduce Measles Mortality
Estimated measles deaths 2000, 2007 2000 : 750 000 deaths 2007 : 197 000 deaths = 1000 death Dots are randomly distributed in countries. The boundaries and names shown and the designations used on this map do not imply the expression of any opinion whatsoever on the part of the World Health Organization concerning the legal status of any country, territory, city or area or of its authorities, or concerning the delimitation of its frontiers or boundaries. Dotted lines on maps represent approximate border lines for which there may not yet be full agreement. WHO 2008. All rights reserved Data source: WHO/IVB, November 2008
Status of Measles Control Reaching the 90% global measles reduction goal by 2010 requires : • India starts catch up campaigns • Improved measles coverage for both routine and follow up campaigns • Political support • Adequate funding
Wild Poliovirus*, 11 Aug 2008 – 10 Feb 2009 Polio Eradication: New Strategic Plan 2009-2013 Active conflict Insecurity & governance Optimizing vaccination efficacy Political & societal buy-in Wild virus type 1 Wild virus type 3 Endemic countries Case or outbreak following importation (0 - 6 months)
Critical to achieve soonest the disease initiatives goals • Key issues • Credibility at stake • Waning commitment • Ways forward • Predictable funding necessary • Commit resources for increased routine coverage in the un-reached • AEFI risk assessment, prevention and management • Expand Case-based surveillance and labnet
Are we on track ?3. By 2015 or earlier – Introduce new vaccines
Global coverage estimates, 1980-2007 DTP3, HepB3 and Hib3 Source: WHO/UNICEF coverage estimates 1980-2007, August 2008, 193 WHO Member States.
Hib3 > 80% (94 countries) Hib3 < 80% (19 countries) Hib vaccine introduced but no coverage data reported (2 countries) Hib vaccine not introduced (78 countries) Countries having introduced Hib vaccine and infant Hib coverage, 2007 The boundaries and names shown and the designations used on this map do not imply the expression of any opinion whatsoever on the part of the World Health Organization concerning the legal status of any country, territory, city or area or of its authorities, or concerning the delimitation of its frontiers or boundaries. Dotted lines on maps represent approximate border lines for which there may not yet be full agreement. WHO 2008. All rights reserved Source: WHO/UNICEF coverage estimates 1980-2007, August 2008
Implementation of other new vaccines • Japanese Encephalitis • Yellow Fever • Rubella • Pneumo (Conjugate vaccines) • Rotavirus Diarrhoea • Typhoid Fever • HPV • Mening Conjugate A
Accelerating the widespread use of new vaccines • Issues • Complex decision-making processes • Costs of new vaccines, a major barrier • Need to reach the un-reached • Ways forward • Adjust timelines of WHO Recommendations • Support routine immunization coverage (cold chain & logistics, planning …) • Cost reduction strategies • Vaccine presentations / Supply
World Health Assembly Resolution on GIVS report, 24 May 2008 (WHA61.15) • … Concerned that many developing countries are not on track to meet health-related MDG Goals, particularly the target of reducing the under-five mortality rate • URGES Member States: • … to implement fully the strategy for reducing measles mortality… • (2) … to improve delivery of high-quality immunization services (and) achieve equitable coverage of at least 80% in all districts by 2010; • (3) to stimulate rapid introduction of new vaccines in accordance with national priorities and to expand coverage of these vaccines;
In brief, all immunization stakeholders should help to… • Focus on the "lagging" countries • Minimize the imbalance in attention and funding for: • Routine Immunization • Accelerated Disease Control Initiatives • New Vaccines Introduction • Improve collaboration in support of the foundation of immunization !
Getting Results • ‘ Over the past 50 years childhood deaths have dropped dramatically. The number of children born went up, while the number who died was cut in half. I think this is one of the most amazing statistics ever…’ Bill Gates in his first annual letter on the work of BMGF, January 2009
Where Did Children Die in 2007? 10,000 deaths
Coverage Along the Continuum of Care Source: Lancet Countdown Coverage writing group, Lancet Countdown special issue, 2008
Number LLINs Distributed and Projected, 2004-2010 2004-7 2008 GF R8 Ph I funds begin Note: Data from 2008 – 2010 is estimated and/or being confirmed
Trends in ITN Coverage, 2000-2006 Source: UNICEF Global Databases, November 2008
Trends in Malaria Cases and Deaths in Relation to Interventions, 4 African countries,2001–2006 (NMCP/WHO data)
Countries Conducting Child Health Days, 2007 Countries conducting CHD in 2007 twice a year(UNICEF)
Coverage with EOS/CHDs VS Routine EPI By Region in Ethiopia, UNICEF 2006
ACSD Evaluation: Results of Integration of EPI With Other Interventions Benin Ghana Key Before ACSD After ACSD Mali * * 3 * * * * * * * * Source: ACSD evaluation, JHSPH Increases in coverage across the board in Ghana and Mali; Benin achieved increases for vitamin A and ITNs. * Change was significant at p < 0.05.
Challenges With Child Health Days • Too many interventions • Some interventions inadequate for campaign delivery • Routine dose of antigens are mostly not part of CHD • Insufficient monitoring of coverage by intervention • Insufficient documentation • Funding not yet sustainable
Malawi 100 100 IPTi1/ DTP2 80 80 60 60 40 40 20 20 0 0 Jul Jan May Sept Mars Apr Jun Dec Feb IPTi2/ DTP3 Mali 100 80 100 60 80 40 60 20 IPTi3/ Measles 40 0 20 Feb Apr Jun Dec Aug 0 Dec Feb Apr Jun Senegal 100 100 80 80 60 60 40 40 20 20 0 0 Apr Aug Jun Oct Jul Jan Nov May Sept Mars IPTi Integration Into EPI Intermittent Preventive Treatment of Malaria at DTP2, DTP3 and measles Benin % of coverage (IPTi / EPI) Ghana Madagascar
Cotrimoxazole (CTX) for HIV Exposed Infants • Initiation of CTX for HIV-exposed infants at DTP1 • DTP1 coverage: >90% in most countries • CTX Regimen: ¼ to 2 tablets (depending on age and formulation) once per day • Child health cards can prompt initiation at DTP1 contact and follow-up
Co-trimoxazole Treatment Initiated at DPT1 Contact and Continued for 8 Months 2007: 6% coverage in 2007 2008: 55% coverage at 8 months
Cause of Deaths Among Under Fives Under-nutrition (underlying cause) Source: 2005 World Health Report
Coverage Along the Continuum of Care GAP 1 GAP 2 GAP 3 Source: Lancet Countdown Coverage writing group, Lancet Countdown special issue, 2008
Proportion of Children <5 with Suspected Pneumonia Taken to Appropriate Health Provider Source: DHS, MICS & other national surveys
And poorest have least access … Source: MICS 3, 2006
How Could EPI Contribute to Pneumonia Control? • Sustain protection against measles with 2 doses • Introduction of new and underutilized vaccines (PCV and Hib) • Implementation of integrated package using RED: • Focused health system strengthening approach • Community-Case Management, Promotion of EBF and Hand-washing, Vitamin A • Challenges to consider? • Joint fundraising/leveraging? • Joint planning? • Joint supply management of vaccines and antibiotics? • Joint monthly monitoring? • Integrated surveillance?
Optimal Management of Diarrhea • Approved in 2003 • Recommended for all cases of acute diarrhea: • Low osmolarity ORS • Oral zinc sulfate 20 mg daily for 14 days • Antibiotics in dysentery • No country has as yet implemented this strategy at scale
Global Interdependence … “If we lose sight of our long-term priority to expand opportunity for the world’s poor and abandon our commitments and partnerships to reduce inequity, we run the risk of emerging from the current economic downturn in a world with even greater disparities in health and education and fewer opportunities for people to improve their lives.” Bill Gates, Davos, 2009
Price Reduction in DTP-HepB, 2006-2009 DTP-HepB: Procured (2001-2007) & PQ offers (2008-2009) 80.00 $1.40 70.00 $1.20 60.00 $1.00 50.00 $0.80 40.00 USD Number of doses (millions) $0.60 30.00 $0.40 20.00 $0.20 10.00 0.00 $0.00 2001 2002 2003 2004 2005 2006 2007 2008 2009 PQ products Pipeline products Weighted average price • Associated Factors: • Multiple suppliers in the market • Manufacturers from developing country • Long term funding through GAVI
Are the Same Conditions Present for DTP HepB Hib ? PQ products Pipeline products Weighted average price • Growth in demand • Multiple suppliers • In the pipeline: developing country suppliers • Long term funding through GAVI