Download
1 / 14
140 likes | 327 Vues
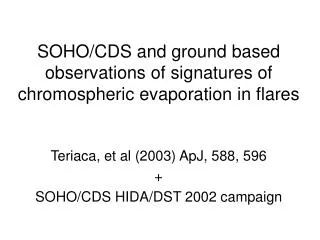
SOHO/CDS and ground based observations of signatures of chromospheric evaporation in flares. Teriaca, et al (2003) ApJ, 588, 596 + SOHO/CDS HIDA/DST 2002 campaign. Coordinated observations by SOHO/CDS and Sac Peak/NSO/DST Comparison of development of chromospheric,

E N D
SOHO/CDS and ground based observations of signatures of chromospheric evaporation in flares Teriaca, et al (2003) ApJ, 588, 596 + SOHO/CDS HIDA/DST 2002 campaign
Coordinated observations by SOHO/CDS and Sac • Peak/NSO/DST • Comparison of development of chromospheric, • transition region and coronal intensities and velocity • field during a two-ribbon flare. • First quasi-simultaneous/spatially resolved • observations of the velocity field in both the • chromosphere and upper atmosphere during • impulsive phase. • Oppositely directed flows are detected in the same • spatial location at different atmospheric levels for the • first time. • Evidence of chromospheric evaporation. Summary of paper
DST CDS Summary of observations Chromospheric lines: Ca II K, H alpha He I 5876A, He I10830A FOV: 160” x 140” Spatial resolution: 1” x 1” H alpha 2” x 2” Ca II, He I Temporal resolution: A few seconds H alpha. 5 min. for others (2” steps) Most H alpha unuseable Lower Transition Region: He I 584A, He II 304A Upper Transition Region: OV 630A Corona: Fe XVI 360A, Fe XIX 592A FOV: 148” by 138” Spatial resolution: 4” x 3”.4 pixel (6” x-steps) Temporal resolution: 5 ½ min.
GOES-8 0.5-4A flux light curve & derivate HXR Peaks 16:01 16:13 SXR Peak 16:20 Temporal derivative of soft X-ray flux used as a proxy for hard X-ray emission
H alpha flare – GOES C1.1 filament neutral line (MDI) filament Filament erupted (16:00), two ribbons developed, 2nd energy release (16:13), 40min. decay phase, filament reappeared (16:34).
He I (black dots) / H alpha images White solid FeXVI Black solid OV Black solid FeXIX
TR flare kernels coincide with chromospheric • footpoints of flaring loops. • He I and OV intensities peak in the earliest phase of • flare (16:02) then decreases with time, but continue to • outline the chromospheric flaring areas. • Maximum coronal emission between the ribbons. • Area and intensity increase with time, peaking at 16:20. • Therefore, He I & OV peak at time of 1st HXR peak. Fe XVI & Fe XIX peak at time of soft X-ray peak. Important points of previous figure
Light curve at position of max. OV brightening Impulsive peaks H alpha, He I, OV. Second peak H alpha, He I. Gradual rise to soft X-ray peak in Fe XVI, Fe XIX.
Upflows and downflows have previously been reported in TR lines. Teriaca et al. found that the flows in H alpha & He I were similar. Velocity Evolution O V He I Line profiles at the time of max. velocity in OV: He I – intensity increase and red-shifted absorption O V – blue-shifted (100-125 km s-1)
Chromospheric downflows > 10 mins. Velocity Evolution (cont.) Fe XIX Enhanced blue wing (160+/-70 km s-1) TR upflows only at 1 time
He I 10830A (up-black dot, down-black solid) <40 km s-1 White OV 629A (up) <100km s-1 Filament Eruption Spatial coincidence of chromsopheric downflow & TR upflow Strongest velocities in HeI, OV not co-spatial with coronal emission -> adjacent hot/cool loops?
Main result He I 10830A chromospheric downflows (40kms-1) He I 584A lower transition region (log T=4.3) upflows (50kms-1) OV 629A upper transition region (log T=5.4) upflows (100kms-1) Fe XIX 592A coronal (log T=6.9) upflows (160kms-1) All measured quasi-simultaneously at the same spatial location for the first time.
Discussion 1 Eruption of filament triggers flare. Rising filament stretches overlying magnetic field -> reconnection. Filament reappears later, suggests only a portion was affected. Coronal emission located between chromos./TR footpoints and had longer evolutionary time -> HXR, TR emission related to impulsive energy release, thermal phase is an atmospheric response.
Discussion 2 Oppositely directed flows in different atmospheric layers originate from same flare kernels -> chromospheric evaporation. Momentum balance: Pdown=1.2-12x1019g cms-1 Pup =2-6.9x10¹⁹g cms-1 BUT time-delay between CDS & DST > typical duration of impulsive bursts (30-90s) -> not same flaring episode, probably distinct events within same area. OV velocity contours suggest TR loops adjacent to coronal loops -> need multistructure hydro-models to explain chromospheric evaporation in TR/corona simultaneously.