Download

1 / 36
360 likes | 464 Vues
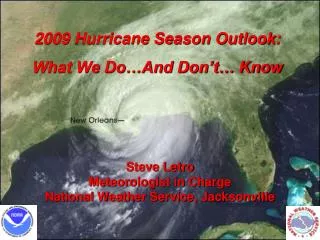
2010 Hurricane Season Outlook and Considerations. Jeff Garmon Warning Coordination Meteorologist David McShane Meteorologist in Charge NOAA – National Weather Service Weather Forecast Office Mobile, AL. National Weather Service Hurricane Forecasting Operations.

E N D
2010 Hurricane Season Outlook and Considerations Jeff Garmon Warning Coordination Meteorologist David McShane Meteorologist in Charge NOAA – National Weather Service Weather Forecast Office Mobile, AL
National Weather ServiceHurricane Forecasting Operations • National Hurricane Center (Miami) • Track and model forecast guidance • Broad-scale track and intensity parameters • NWS Forecast Office (Mobile) • Storm-scale impacts and timing • Winds • Surge • Tornadoes • Rainfall
Coastal County Population, Texas to Maine Population 53% of the U.S. population now lives within 50 miles of the coast Year Changes to Tropical Cyclone Watch/Warning Lead Times in 2010 • Lead time virtually unchanged while skill in track forecasting has improved • NHC in fact frequently does issue watches and warnings at longer lead time than Directive indicates • Key evacuation decisions now need to be made before 24 h and in some cases before 48 h • Some jurisdictions, businesses, and schools still tag closure decisions to warning or watch
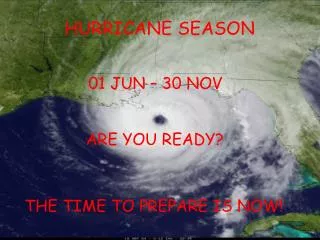
New for 2010 • Tropical Storm / Hurricane Warnings will be issued for onset of Tropical Storm / Hurricane conditions 36 hours in advance. • Tropical Storm / Hurricane Watches will be issued for onset of Tropical Storm / Hurricane conditions 48 hours in advance.
The Ugly – Un-forecasted Rapid Intensity Changes Even some of our best models miss the mark substantially
Gulf of Mexico Rapid Intensifiers • 1932 – TS 180 miles south of GLS – Cat 4 at landfall less than 36h • 1943 , Alicia – both formed south of NOLA landfall less than 72h • Audrey June 1957 – Cat 4 less then 72h after forming • Anita (5), Celia (4), Camille (5) and Opal (4) all less then 96h
1935 Labor Day Hurricane Category 1 to Category 5 in just 36h 7 pm Sept 2 Cat 5 O O 1 am Sept 2 Cat 3 O 7 am Sept 1 Cat 1
Storm surge uncertainty • Extremely sensitive to errors in track, size, structure of wind field, angle of approach, and forward speed. • Improvement in meteorological forecast over next decade will not negate the error function for surge forecast. • Always expect enough track/intensity error to change the deterministic surge forecast...even 12 hours in advance.
NHC TRACK ERROR 12 hr. OUT 133 mph, 933 mb. Hurricane Advisory – Approximately 12 hr. before landfall
Rmax=25 mi (forecast) Surge Based on NHC -12 hr. Advisory
ACTUAL TRACK TRACK FORECAST 133 mph, 933 mb. Actual Hurricane Track 30 mi. E of -12 hr. Advisory Forecast Track
Rmax=40 mi Surge Based on NHC Storm Best Track
Effect of Vertical Wind Shear 40,000 ft/200 mb H H Typical cruising altitude of commercial airplane Heat Heat 5,000 ft/850 mb L L Surface
El Nino – La Nina effects the position of the Jetstream Stronger southern stream upper jet = more wind shear over Gulf
What can we expect in 2010? El Nino is gone. Weak La Nina possible by mid to late summer. • Decreased wind shear values will very likely mean a marked increase in activity compared to last year. • Significant wind shear due to a strengthening El Nino in 2009 resulted in a below average number of storms in the Atlantic Basin in 2009.
Model-Based El Niño/ La Niña (ENSO) Forecasts for the Niño 3.4 region El Niño ENSO-Neutral La Niña The ENSO forecast models are predicting either ENSO-Neutral or La Niña conditions during the Atlantic hurricane season. The forecasts are increasingly indicating La Niña during Aug-Oct (ASO) 2010 (Figure courtesy of the International Research Institute).
Pacific Ocean Conditions are favorable for La Niña to Develop Subsurface Temperatures (oC) 5-day Mean Centered 13 May 2010 Weekly SST (oC) Centered on 12 May 2010 El Niño has dissipated. Negative SST anomalies are now present in the equatorial Pacific. Sub-surface temperatures are below average across the eastern half of equatorial Pacific. Equatorial Upper Ocean (0-300m) Heat Content 180o-100oW Since March 2010, the oceanic heat content has decreased markedly. 12
Expected Atlantic Basin Conditions During August-October 2010 Much Warmer Atlantic SSTs The predicted set of conditions forAugust-October 2010 mainly reflects the expected continuation of the tropical multi-decadal signal, above-average Atlantic Ocean temperatures, and a possible La Niña-related reduction in vertical wind shear. 7
Recent Circulation Anomalies (Last 30 days) Typically Associated With Active Atlantic Phase of Tropical Multi-decadal Signal 200-hPa Winds (m s-1) 850-hPa Winds (m s-1) Vertical Wind Shear (m s-1) Tropical low-level westerly wind anomalies across eastern Pacific and Atlantic (Blue circle). Tropical upper-level easterly wind anomalies across eastern Pacific and Atlantic (Blue circle). 200-hPa Streamfunction Reduced vertical wind shear across heart of the MDR (Blue shading in green box). Anticyclonic anomalies across tropical Atlantic in both hemispheres (Blue circle). 10
Warmer SSTs in the Tropical Atlantic Latest Weekly SST Departures (oC) Monthly SST Departures (oC) The Main Development Region (MDR) for Atlantic hurricanes (Green Box) is currently experiencing record warm SSTs, with departures exceeding +1.5oC nearly everywhere east of the Caribbean Islands. SST departures in the MDR increased sharply during February-April 2010 (Top), and reached record levels in March and April. These departures are much larger elsewhere in the global Tropics (Bottom), indicating a local warming rather than global warming.
The 2010 Atlantic Outlook in a Historical Perspective NOAA’s 2010 Atlantic hurricane season outlook indicates a 70% probability of an ACE range of 155%-270% of the median. An ACE value above 175% of median reflects an extremely active (also called hyperactive) season.
Based on this forecast, I will: • A) Plan for more impacts than last year • B) Cry “Holy &^%$” and move to Canada • C) Do the same as every year
Track Map H Tropical cyclones are born, live, and die in a variety of ways
Oil Spill and Gulf Storms • Direct hit of major storm – big surge more damaging than oil (life threatening and mix of toxic material from damage caused by surge) • Weak storm or large storm passing well to south raises water levels 2 to 5 feet bringing oil to places previously untouched.
Contact Information Jeff.Garmon@noaa.gov 251-633-6443 x223 David.McShane@noaa.gov 251-633-6443 x222