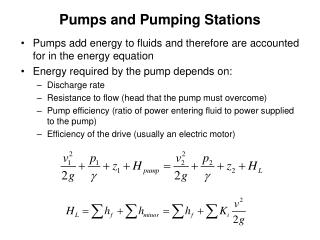
Piping and Pumping
Chemical Engineering and Materials Science Syracuse University. Piping and Pumping. Process Design CEN 574 Spring 2004. Outline. Pipe routing Optimum pipe diameter Pressure drop through piping Piping costs Pump types and characteristics Pump curves NPSH and cavitation

Piping and Pumping
E N D
Presentation Transcript
Chemical Engineering and Materials Science Syracuse University Piping and Pumping Process Design CEN 574 Spring 2004
Outline • Pipe routing • Optimum pipe diameter • Pressure drop through piping • Piping costs • Pump types and characteristics • Pump curves • NPSH and cavitation • Regulation of flow • Pump installation design
Piping and Pumping Learning Objectives At the end of this section, you should be able to… • Draw a three dimensional pipe routing with layout and plan views. • Calculate the optimum pipe diameter for an application. • Calculate the pressure drop through a length of pipe with associated valves. • Estimate the cost of a piping run including installation, insulation, and hangars.
List the types of pumps, their characteristics, and select an appropriate type for a specified application. • Draw the typical flow control loop for a centrifugal pump on a P&ID. • Describe the features of a pump curve. • Use a pump curve to select an appropriate pump and impellor size for an application. • Predict the outcome from a pump impellor change. • Define cavitation and the pressure profile within a centrifugal pump. • Calculate the required NPSH for a given pump installation. • Identify the appropriate steps to design a pump installation.
References • Appendix III.3 (pg 642-46) in Seider et al., Process Design Principals (our text for this class). • Chapter 12 in Turton et al., Analysis, Synthesis, and Design of Chemical Processes. • Chapter 13 in Peters and Timmerhaus, Plant Design and Economics for Chemical Engineers. • Chapter 8 in McCabe, Smith and Harriott, Unit Operations of Chemical Engineering.
Pipe Routing • The following figures show a layout (looking from the top) and plan (looking from the side) view of vessels. • We want to rout pipe from the feed tank to the reactor.
piping chase reactor Plan View steam header 40 ft feed tank 60 ft 35 ft 50 ft
Layout View: Looking Down steam header 40 ft feed tank piping chase 45 ft 30 ft reactor 10 ft reactor 35 ft 50 ft
Plan View piping chase reactor = out = in steam header 40 ft feed tank 60 ft 35 ft 50 ft
Layout View steam header 85 ft 30 ft feed tank 20 ft 35 ft 60 ft 10 ft 10 ft reactor
Pipe Routing Exercise • Form groups of two. • Draw a three dimensional routing for pipe from the steam header to the feed tank on both the plan view and the layout view.
Size the Pump • Determine optimum pipe size. • Determine pressure drop through pipe run. 200 ft globe valve check valve 150 ft 100 gpm
Optimum Pipe Diameter The optimum pipe diameter gives the least total cost for annual pumping power and fixed costs. As D , fixed costs , but pumping power costs .
Optimum Optimum Pipe Diameter Total Cost Annualized Capital Cost Pumping Power Cost
Example • Two methods to determine the optimum diameter: Velocity guidelines and Nomograph. • Example: What is the optimum pipe diameter for 100 gpm water.
Using Velocity Guidelines • Velocity = 3-10 ft/s = flow rate/area • Given a flow rate (100 gpm), solve for area. • Area = (/4)D2, solve for optimum D. • Optimum pipe diameter = 2.6-3.6 in. Select standard size, nominal 3 in. pipe.
3.3 in optimum diameter Nomograph -Convert gpm to cfm 13.4 cfm. -Find cfm on left axis. -Find density (62 lb/ft3) on right axis. -Draw a line between points. -Read optimum diameter from middle axis.
Practice Problem • Find the optimum pipe diameter for 100 ft3 of air at 40 psig/min. • A = (s/50ft)(min/60 s)(100 ft3/min) = 0.033 ft2 • 0.033 ft2 = 3.14d2/4 • d = 2.47 in
Piping Guidelines • Slope to drains. • Add cleanouts (Ts at elbows) frequently. • Add flanges around valves for maintenance. • Use screwed fitting only for 1.5 in or less piping. • Schedule 40 most common.
Calculating the Pressure Drop through a Pipe Run • Use the article Estimating pipeline head loss from Chemical Processing (pg 9-12). • P = (/144)(Z+[v22-v12]/2g+hL) • Typically neglect velocity differences for subsonic velocities. • hL = head loss due to 1) friction in pipe, and 2) valves and fittings. • hL(friction) = c1fLq2/d5
c1 = conversion constant from Table 1 = 0.0311. • f = friction factor from Table 6 = 0.018. • L = length of pipe = 200 ft + 150 ft = 350 ft. • q = flow rate = 100 gpm. • d = actual pipe diameter of 3” nominal from Table 8 = 3.068 in . • hL due to friction = 7.2 ft of liquid head
Loss Due to Fittings • K= 0.5 entrance • K = 1.0 exit • K=f(L/d)=(0.018)(20) flow through tee • K=3[(0.018)(14)] elbows • K=0.018(340) globe • K=0.018(600) check valve Sum K = 19.5
hL due to fittings = c3Ksumq2/d4 = 5.7 ft of liquid head loss due to fittings. • hLsum=7.2 + 5.7 ft of liquid head loss • Using Bernoulli Equation P = (/144)(Z+[v22-v12]/2g+hLsum) P = ( /144)(150+0+12.9)= 70.1 psi due mostly to elevation. Use P to size pump. elevation velocity friction and fittings
Find the Pressure Drop 400 ft 50 ft check valve 400 gpm water 4 in pipe
Estimating Pipe Costs Use charts from Peters and Timmerhaus. Pipe Fittings (T, elbow, etc.) Valves Insulation Hangars Installation
Note: not 2003 $ $/linear ft
Pumps – Moving Liquids • Centrifugal • Positive displacement • Reciprocating: fluid chamber stationary, check valves • Rotary: fluid chamber moves
Positive Displacement: Reciprocating • Piston: up to 50 atm • Plunger: up to 1,500 atm • Diaphragm: up to 100 atm, ideal for corrosive fluids • Efficiency 40-50% for small pumps, 70-90% for large pumps
Positive Displacement: Rotary • Gear, lobe, screw, cam, vane • For viscous fluids up to 200 atm • Very close tolerances
Comparisons: Centrifugal • larger flow rates • not self priming • discharge dependent of downstream pressure drop • down stream discharge can be closed without damage • uniform pressure without pulsation • direct motor drive • less maintenance • wide variety of fluids
Comparisons: Positive Displacement • smaller flow rates • higher pressures • self priming • discharge flow rate independent of pressure – utilized for metering of fluids • down stream discharge cannot be closed without damage – bypass with relief valve required • pulsating flow • gear box required (lower speeds) • higher maintenance
Advantages simple and cheap uniform pressure, without shock or pulsation direct coupling to motor discharge line may be closed can handle liquid with large amounts of solids no close metal-to-metal fits no valves involved in pump operation maintenance costs are lower Disadvantages cannot be operated at high discharge pressures must be primed maximum efficiency holds for a narrow range of operating conditions cannot handle viscous fluids efficiently Centrifugal Pumps
Moving Gases • Compression ratio = Pout/Pin • Fans: large volumes, small discharge pressure • Blowers: compression ratio 3-4, usually not cooled • Compressors: compression ratio >10, usually cooled. • Centrifugal (often multistage) • Positive displacement
Pump Curves For a given pump • The pressure produced at a given flow rate increases with increasing impeller diameter. • Low flow rates at high head, high flow rates at high head. • Head is sensitive to flow rate at high flow rates. • Head insensitive to flow rate at lower flow rates.
Pump Curve- used to determine which pump to purchase.- provided by the manufacturer.
Low flow at high head Pressure increases with diameter Head sensitive to flow at high flow rates Pump Curve
NPSH and Cavitation • NPSH = Net Positive Suction Head • Frictional losses at the entrance to the pump cause the liquid pressure to drop upon entering the pump. • If the the feed is saturated, a reduction in pressure will result in vaporization of the liquid. • Vaporization = bubbles, large volume changes, damage to the pump (noise and corrosion).
NPSH • To install a pump, the actual NPSH must be equal to or greater than the required NPSH, which is supplied by the manufacturer. • Typically, NPSH required for small pumps is 2-4 psi, and for large pumps is 22 psi. • To calculate actual NPSH… NPSHactual= Pinlet-P* (vapor pressure) Pinlet = P(top of tank, atmospheric) + gh - 2fLeqV2/D
What if NPSHactual < NPSHrequired? INCREASE NPSHactual • cool liquid at pump inlet (T decreases, P* decreases) • increase static head (height of liquid in feed tank) • increase feed diameter (reduces velocity, reduces frictional losses) (standard practice)