Chapter 6: Consumption and Investment
870 likes | 1.36k Vues
Chapter 6: Consumption and Investment. By: Elvis Guzman “06”. People make consumption-spending and consumption production decisions simultaneously and independently from each other. Reason!!!. This may explain why an economy slides into recession or rockets to prosperity.

Chapter 6: Consumption and Investment
E N D
Presentation Transcript
Chapter 6: Consumption and Investment By: Elvis Guzman “06” People make consumption-spending and consumption production decisions simultaneously and independently from each other.
Reason!!! This may explain why an economy slides into recession or rockets to prosperity
What Determines Consumption Spending How do people choose their level of consumption spending?? It depends on the level of a person’s disposable income. The rich consume more than the poor because the rich have more money!! DUH!!!!
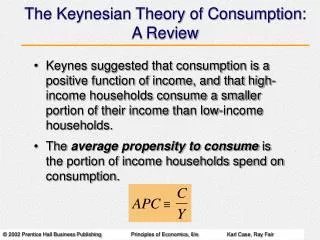
Consumption Function The relationship between consumption and income is the consumption function. C= f(Y) C represents consumption Y represents income
Keyne’s Absolute Income Hypothesis Keyne’s hypothesized that although people who earn high incomes spend more on consumption than the people who earn less, they are less inclined to spend as much “out of a given increase in income” than are those earning less. - 1936 Book: The General Theory of Employment, Interest, and Money
FOR EXAMPLE!!!!!!!! Jessica Alba’s consumption spending is greater than Megan’s. Yet, if both were given $1,000, Jessica would likely spend less of the $1,000 on consumption than Megan.
Absolute Income Hypothesis As national income increases consumption spending increases, but by diminishing amounts. That is, as national income increases, the MPC decreases.
FOR EXAMPLE!!!! A millionaire won’t run off to the store and spend a $500 gift card; he would probably save it. In Keyne’s view, the millionaire’s “margin of comfort” is already provided, and the “stronger motive” guiding his behavior, then, becomes “accumaltion”. A regular guy would spend it on immediate primary needs!!!!
Marginal Propensity to Consume MPC The ratio of the change in consumption spending to a given change in income. MPC = Change in C Change in Y
MPC • MPC is the SLOPE of the Consumption Curve • MPC falls as the absolute level of income increases (according to Keynes)
Make Sense? • Keynes was WRONG. Five years later, Simon Kuznets published “National Income and Its Composition” which refuted Keynes’s theory. He found that a nation’s MPC tends to remain fairly constant regardless of the absolute level of national income.
Duesenberry’s Relative Income Hypothesis According to Duensberry, consumption spending is rooted in status. High income people not only consume more goods and services than others, but also set consumption standards for everybody else.
Relative Income Hypothesis (Duesenbery) As national income increases, consumption spending increases as well, but always by the same amount. That is as national income increases, MPC remains constant. - As long as a person’s relative income stays the same, their MPC remains constant
Permanent Income Hypothesis – Milton Friedman (Nobel Prize in 1976) Permanent income hypothesis- a person’s consumption spending is related to his or her permanent income
Definitions!!!!! Permanent Income: The regular income a person expects to earn annually. It may differ by some unexpected gain or loss from the actual income earned. (Milton Friedman)
More Definitions (Still Friedman) Transitory Income- The unexpected gain or loss of income that a person experiences. It is the difference between a person’s regular and actual income in any year. Don’t change consumption habits based on unexpected changes in income Can create negative savings when experience loss of income, but MPC remains constant, based on permanent income
Life-cycle Hypothesis (Franco Modigliani, MIT, Nobel Prize in 1985) Life-cycle hypothesis- Typically, a person’s MPC is relatively high during young adulthood, decreases during the middle-age years, and increases when the person is near or in retirement.
Modigliani’s cont’d MPC for young adults is relatively high. They buy first homes, cars, stocks of household durables etc.
Modigliani’s cont’d When they become middle-aged, their consumption spending also increases. They tend to consume more because they earn more, but the ratio of changes in consumption to changes in income tends to fall. That is, their MPC falls!
Modigliani’s cont’d Nearing or end of retirement, their MPC tends to rise. They become more careful about their spending and their incomes fall.
Life-Cycle Hypothesis • Is consistent with constant MPC theory – as long as birth and death rates remain fairly constant, the percentage of the population in the three stages of life are fairly constant, resulting in a constant MPC.
MORE DEFINITIONS Autonomous consumption: Consumption spending that is independent of the level of income. Consumption spending is simply unavoidable. The spending takes place regardless of level of income. Therefore the consumption curve intersects the vertical axis at a point above the origin (the Y intercept)
Consumption Curve • Just like demand and/or supply curve, a change in national income leads to movement along the consumption curve, not a shift.
What factors shift the consumption curve? Real assets and money holdings Expectations of price changes Credit and interest rates Taxation
Real Asset and Money Holdings • When people’s real asset and money holdings increase, their consumption increases as well • Imagine winning the lottery • Will shift the consumption curve up, NOT to the right like a demand or supply curve
Expectations of price changes • If consumers expect inflation, they spend their money NOW, knowing it will soon be worth less • Expected inflation = Increased Consumption Now
Credit and Interest Rates • If credit is more available or interest rates are lower, consumption will increase • Example: Buying a house, a car, a computer, etc.
Taxation • If the government raises taxes, disposable income will decrease, consumption will decrease • The opposite is also true
The consumption Equation Adding autonomous consumption to consumption spending induced by income generates a specific form of the consumption function. C = a + bY
BY THE WAY • A = autonomous consumption spending • B = marginal propensity to consume • Y = level of national income
What determines the level of saving? Saving- that part of national income not spent on consumption. S = Y – C Savings = Income - Consumption
Marginal Propensity to Save MPS- the change in saving induced by a change in income!!! MPS = Change in S Change in Y The marginal propensity to consume and save add up to 100% (or 1)
FORMULAS MPC + MPS = 1 OR MPS = 1 - MPC
Savings • Savings can actually be negative (also called dissaving) • They can consume more than their income via running down accumulated wealth
Income Curve 45 degree line –a line drawn at a 45 degree angle, showing all points at which the distance to the horizontal axis equals the distance to the vertical axis.
The Investment Function • At the same time that consumers are deciding how much of their income to spend on consumption and how much to save, producers in the economy are deciding how much to spend on new investment • Intended investment – Investment spending that producers intend to undertake. Intended investment doesn’t always end up realized • Level of investment doesn’t have to do with National Income level – more to do with phase of business cycle
Determinants of Investment Autonomous investment: Investment that is independent of the level of income. - There are four determinants of autonomous investment: level of technology, rate of interest, expectations of future economic growth, and the rate of capacity utilization
Determinants of Autonomous Investment Level of technology • The introduction of new technologies is one of the mainsprings of investment. • Technological leaps produce extensive networks of investment spending. • Example: The railroads
Rate of interest Producers undertake investment when they believe the rate of return generated by the investment will exceed the interest rate, that is, the cost of borrowing investment funds. - The lower the interest rate, the more investment is a good option
Expectations of future economic growth Expectations of future economic growth. Investment spending reflects how producers view the future. Future expectations are shaped by past performance. - It’s not the level of national income, but the projected changes to income that influences producers
The rate of capacity utilization - Producers don’t usually choose to operate at 100% capacity utilization because it reduces their ability to expand production on demand, they usually choose a rate to have some short-run flexibility. - How much flexibility producers end up choosing influences the economy’s level of production. For producers who choose to operate close to full capacity, a moderate increase in sales may shift them quickly into investment spending.
What is the consumption function???? • 1. The consumption function expresses the relationship between consumption spending in the economy (C) and the economy’s level of income (Y). It is written as C = f(Y). As income increases, so does consumption spending