Enhancing Transit Planning with T-BEST 2.1: A Comprehensive Software Overview
420 likes | 548 Vues
T-BEST 2.1 is a cutting-edge software developed for comprehensive transit network modeling, management, and analysis tailored to short-term planning needs. Presented to PennDOT, this tool supports service planning, ridership forecasting, and network adjustments based on various factors like seasonal patterns and land use changes. Integrated with existing transit systems, it captures critical data for estimating boardings and evaluating alternative service options. The software evolves with advancements in transit technologies and seeks to enhance operational effectiveness in transit systems.

Enhancing Transit Planning with T-BEST 2.1: A Comprehensive Software Overview
E N D
Presentation Transcript
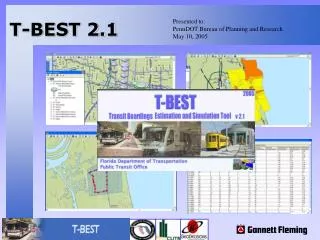
T-BEST 2.1 Presented to: PennDOT Bureau of Planning and Research May 10, 2005 T-BEST 2.1
Project Team • Florida Department of Transportation, Public Transit Office • Center for Urban Transportation Research (CUTR) • University of South Florida • GeoDecisions, A Division of Gannett Fleming • Gannett Fleming, Inc.
Outline • Need for T-BEST • T-BEST Applications • T-BEST Model Concepts • T-BEST Analysis • T-BEST Software Overview • T-BEST Implementation • Conclusions • Future Enhancements • Demonstration
Need For T-BEST • Systems Planning Software • Traditional 4 Step Planning Travel Models • Long term (20+years), Systems Level • Multimodal • Primarily Suited for Major Investment Studies
Need For T-BEST • Transit Operational Level Software • Trapeze, Hastus • Routing & Scheduling • Do Not Allow for Evaluation of Service Alternatives
T-BEST Applications What is T-BEST? • Comprehensive Transit Network Modeling, Management and Analysis Software designed for short-term transit planning • Direct and Transfer Stop-Level Boardings Estimation
T-BEST Applications • Service Planning • Stop/Route Adjustments based on: • Seasonal Patterns • Land Use Changes • Road Construction • Service Changes • Short-Term Ridership Forecasting • Adjust Socio-Economic for expected growth • Fare Structure changes • New Routes, Stops • New Technologies (BRT, Rail, Trolley, etc)
T-BEST Applications • Support for Transit Development Plans • Transit System Management • Network Editing/Coding • Integration with ArcGIS • Can serve as a baseline operational software
T-BEST Model Concepts • Transit systems planning considerations: • Accessibility • Availability • Quality of Service • Ridership • Temporal Characteristics • Transfers • Route/Network Design • Fare Policies and Structure • Alternative Modal Options/Technologies/Route Types • Disaggregate Stop-Level Analysis
T-BEST Model Concepts • Transit ridership strongly affected by: • Destination accessibility • Temporal availability • Network connectivity • Desire to have T-BEST sensitive to all three aspects of transit accessibility • Ability to test effects of alternative route and network design configurations on transit boardings
T-BEST Model Concepts Neighboring Stops • Riders may choose alternative stops, routes, destinations for pursuing activities • Neighboring stops effectively capture effects of competing routes/stops • Neighboring stops are those with overlapping buffers with subject stop • N1: Same Route, Same Direction • N2: Same Route, Opposite Direction • N3: Other Routes, Similar Destinations
T-BEST Model Concepts Network Accessibility Measures • H1: Stops from which one can reach the N3 neighboring stops (Interest: Feeders for potential transfers) • H2: Downstream stops that can be reached from subject stop via the transit network (Interest: Capture potential downstream activities) • H3: Upstream stops that can be reached from the N2 stops (Interest: Capture potential upstream activities) • H4: Stops that can be reached from the N3 neighboring stops (Interest: Capture potential activities on other routes) • H5: Stops in H4 that overlap with stops in H3 (Interest: Capture potential competing activities)
T-BEST Model Concepts • Computing Transit Accessibility • Access / Egress at Given Stop • Accessibility to Other Stops • Composite Impedance Factors • Wait Time • Boarding Time • In-vehicle Time • # of Transfers • Transit Walking Time • Transfer Fare
T-BEST Model Concepts • Estimate Boardings at a Stop by: • Route • Direction • Time Period • Model Estimates two Boarding Types: • Direct (Walk, Bike & Auto Access) • Transfer (Transit Access)
T-BEST Model Concepts Direct Boarding Equation • s refers to stop on a route in a given direction and • n refers to time period • D = direct boardings • R = number of bus runs (arrivals) • B = vector of buffer characteristics (population/employment) • Oi = accessibility measures = characteristics of buffer areas of accessible stops, Hi, i = 2, 3, 4, 5 • X = vector of other route and stop characteristics
T-BEST Model Concepts Transfer Boarding Equation • T = transfer boardings • R = number of bus runs (arrivals) • O1 = accessibility measure = total boardings at all stops, H1, during period n toward stop s • Y = vector of other route and stop characteristics • Methodology thus includes both direct and transfer boardings equations • Accessibility vectors play major role
T-BEST Model Concepts T-BEST Data Requirements • Transit Route & Stops Location • Transit Route Schedule • Transit Route & Stop Names • Transit System • Fare Structure • Transfer Hubs • Interlined Routes
T-BEST Model Concepts T-BEST Data Requirements • Florida Source Data provided with the software: • 2000 Census data with pre-formatted SF1 and SF3 variables • 2000 InfoUSA Employment data grouped by Commercial, Industrial, and Service • 2000 GDT Street Networks • Other background GIS layers
T-BEST Analysis Model Outputs • T-BEST Calculates • Direct + Transfer = Total Boardings • Arrivals • Transfer Opportunities • Time-Period Specific Estimations • Peak • Off-Peak • Night • Aggregate Model Outputs by: • Weekday • Weekend • All Time Periods • Saturday • Sunday
T-BEST Analysis Time Period Aggregation Route 101 Inbound Stop # 10161000 Example: Model Results by Time Period
T-BEST Analysis Route Level Aggregation Outputs • Performance Measures • Boardings • Route / Service Miles • Service Hours • Boarding per Service Mile / Hour • Average Boarding per Service Run • Aggregation by: • Route Type • Technology • Report on All Routes = System-wide Analysis
T-BEST Analysis Area-Based Aggregation • Summarize Model Results with a Polygon Shapefile (Districts, TAZ, Census Blocks, etc.) • User-Defined Global Subareas • Analyze Model Output across multiple Scenarios
T-BEST Analysis T-BEST Reports • Calculates Sub-Totals by Route or Planning Area • Total for all selected inputs (stop, route, area) • Automatic Map Display Stop-level boardings (pie chart) or area distribution
T-BEST Software Comprehensive Model System • Manage Multiple Transit Systems • Scenario/Alternative Management Tools • Update Base Year Model • Internal Model Runs • Unlimited Analysis potential
T-BEST Software Transit System Management Create new Transit Systems Manage Existing Transit Systems Delete Systems All Files/Data managed internal in the software
T-BEST Software Scenario/Alternative Management Manage Alternatives Create Base Year Model Adjust Socio-Economic Variables to Future Year Incorporate Local Employment Data
T-BEST Software System Properties Fare Structure Transfer Hubs Interlined Routes Local Employment Data Socio-Economic growth applied to future year forecasts
T-BEST Software Scenario Editor Integrated editing, coding and analysis environment GIS-enabled network editing Time Period specific variables Stop-level socio-economic updates
T-BEST Software GIS Features T-BEST developed with ArcObjects Add local data or images Edit Symbols and Labels Save custom Map setup with Scenario
T-BEST Software Model Equations Edit Direct and Transfer Boarding Coeffecients
T-BEST Software Interactive Reporting Route-level Performance Measures Aggregate Records by: • Route(s) • Sub-Area • Selection Set • Planning Area
T-BEST Software Analysis Mapping Automated Map Analysis • Flexible Mapping Environment
T-BEST Software Quality Control Measures • Visualize Model Accessiblity Calculations with impedance (H1-H5) • Locate Neighboring Stops (N1 – N3) • Shortest Path Algorithm
T-BEST Software Model Engine • Time Period Specific output for each stop • Option to run for selected time-periods • Optomized model calculations to run only necessary components
T-BEST Software Additional Features • Direct conversion of T-BEST Map into ArcMap Layout • Export all Reports or lists to delimited text files • Export Map to raster or PDF • Save Sub-Areas and Selection Sets for use in multiple Scenarios • Scenario Log • Extensive User-Guide
T-BEST Implementation Default Implementation • Download & Install Software (www.tbest.org) • Default coefficients provided • Calibration for Portland, Oregon in progress • Calibration to Local Area • Local Stop Level Ridership Data • Develop Socio-Economic data • Create T-BEST Transit Network • Re-estimate and Re-calibrate
T-BEST Implementation Custom Implementation • Software • Data Model • Interface with Systems Planning and Operational Software • Scale T-BEST to your Enterprise Environment
T-BEST Implementation • Recommended Hardware • 2.0 gHZ Pentium M Processor or higher • 1 GB Ram • Required Software • Window 2000 or XP • ArcView 9.x
Conclusions • T-BEST provides a powerful framework for modeling transit ridership at stop level • Incorporates effects of accessibility and connectivity on ridership • Accessibility and impedance computations very sophisticated, accurate, and automated in software • More precisely accommodates effects of service span and frequency (temporal aspects) • Focus on ease of use and quick response capability
Future Enhancements • Enhancements for T-BEST 3.0: • Automated calibration and scaling procedures • T-BEST Analyzer • Enhance stop-level accessibility measure using alternative methodologies (e.g., network-based, regression, TLOS) • Statewide Transit Network Input
Future Enhancements • Enhancements for T-BEST 4.0: • Develop sets of equations for different urban area sizes and trip purposes • Spatial distribution of boardings to develop a stop-to-stop O-D matrix • Greater sensitivity to route type, technology type, park-n-ride facilities, and special generators
T-BEST 2.1 Demonstration