Hidden Markov Models
360 likes | 520 Vues
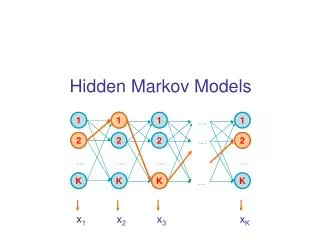
1. 2. 2. 1. 1. 1. 1. …. 2. 2. 2. 2. …. K. …. …. …. …. x 1. K. K. K. K. x 2. x 3. x K. …. Hidden Markov Models. Viterbi, Forward, Backward. VITERBI Initialization: V 0 (0) = 1 V k (0) = 0, for all k > 0 Iteration: V l (i) = e l (x i ) max k V k (i-1) a kl

Hidden Markov Models
E N D
Presentation Transcript
1 2 2 1 1 1 1 … 2 2 2 2 … K … … … … x1 K K K K x2 x3 xK … Hidden Markov Models
Viterbi, Forward, Backward VITERBI Initialization: V0(0) = 1 Vk(0) = 0, for all k > 0 Iteration: Vl(i) = el(xi) maxkVk(i-1) akl Termination: P(x, *) = maxkVk(N) BACKWARD Initialization: bk(N) = ak0, for all k Iteration: bl(i) = k el(xi+1) akl bk(i+1) Termination: P(x) = k a0k ek(x1) bk(1) FORWARD Initialization: f0(0) = 1 fk(0) = 0, for all k > 0 Iteration: fl(i) = el(xi) k fk(i-1) akl Termination: P(x) = k fk(N) ak0
A+ C+ G+ T+ A- C- G- T- A modeling Example CpG islands in DNA sequences
Methylation & Silencing • One way cells differentiate is methylation • Addition of CH3in C-nucleotides • Silences genes in region • CG (denoted CpG) often mutates to TG, when methylated • In each cell, one copy of X is silenced, methylation plays role • Methylation is inherited during cell division
Example: CpG Islands CpG nucleotides in the genome are frequently methylated (Write CpG not to confuse with CG base pair) C methyl-C T Methylation often suppressed around genes, promoters CpG islands
Example: CpG Islands • In CpG islands, • CG is more frequent • Other pairs (AA, AG, AT…) have different frequencies Question: Detect CpG islands computationally
A model of CpG Islands – (1) Architecture A+ C+ G+ T+ CpG Island A- C- G- T- Not CpG Island
A model of CpG Islands – (2) Transitions How do we estimate parameters of the model? Emission probabilities: 1/0 • Transition probabilities within CpG islands Established from known CpG islands (Training Set) • Transition probabilities within other regions Established from known non-CpG islands (Training Set) Note: these transitions out of each state add up to one—no room for transitions between (+) and (-) states = 1 = 1 = 1 = 1 = 1 = 1 = 1 = 1
Log Likehoods—Telling “Prediction” from “Random” Another way to see effects of transitions: Log likelihoods L(u, v) = log[ P(uv | + ) / P(uv | -) ] Given a region x = x1…xN A quick-&-dirty way to decide whether entire x is CpG P(x is CpG) > P(x is not CpG) i L(xi, xi+1) > 0
A model of CpG Islands – (2) Transitions • What about transitions between (+) and (-) states? • They affect • Avg. length of CpG island • Avg. separation between two CpG islands 1-p Length distribution of region X: P[lX = 1] = 1-p P[lX = 2] = p(1-p) … P[lX= k] = pk-1(1-p) E[lX] = 1/(1-p) Geometric distribution, with mean 1/(1-p) X Y p q 1-q
A+ C+ G+ T+ 1–p A- C- G- T- A model of CpG Islands – (2) Transitions Right now, aA+A+ + aA+C+ + aA+G+ + aA+T+ = 1 We need to adjust aij so as to allow transitions between (+) and (-) states Say we want with probability p++ to stay within CpG, p-- to stay within non-CpG • Let’s adjust all probs by that factor: example, let aA+G+ p++ × aA+G+ • Now, let’s calculate probs between (+) and (-) states • Total prob aA+S where S is a (-) state, is (1 – p++) • Let qA-, qC-, qG-, qT- be the proportions of A, C, G, and T within non-CpG states in training set • Then, let aA+A- = (1 – p++) × qA-; aA+C- = (1 – p++) × qC-; … • Do the same for (-) to (+) states • OK, but how do we estimate p++ and p--? • Estimate average length of a CpG island: l+ = 1/(1-p) p = 1 – 1/l+ • Do the same for length between two CpG islands, l-
Applications of the model Given a DNA region x, The Viterbi algorithm predicts locations of CpG islands Given a nucleotide xi, (say xi = A) The Viterbi parse tells whether xi is in a CpG island in the most likely general scenario The Forward/Backward algorithms can calculate P(xi is in CpG island) = P(i = A+ | x) Posterior Decodingcan assign locally optimal predictions of CpG islands ^i = argmaxkP(i = k | x)
What if a new genome comes? • We just sequenced the porcupine genome • We know CpG islands play the same role in this genome • However, we have no known CpG islands for porcupines • We suspect the frequency and characteristics of CpG islands are quite different in porcupines How do we adjust the parameters in our model? LEARNING
Problem 3: Learning Re-estimate the parameters of the model based on training data
Two learning scenarios • Estimation when the “right answer” is known Examples: GIVEN: a genomic region x = x1…x1,000,000 where we have good (experimental) annotations of the CpG islands GIVEN: the casino player allows us to observe him one evening, as he changes dice and produces 10,000 rolls • Estimation when the “right answer” is unknown Examples: GIVEN: the porcupine genome; we don’t know how frequent are the CpG islands there, neither do we know their composition GIVEN: 10,000 rolls of the casino player, but we don’t see when he changes dice QUESTION: Update the parameters of the model to maximize P(x|)
1. When the right answer is known Given x = x1…xN for which the true = 1…N is known, Define: Akl = # times kl transition occurs in Ek(b) = # times state k in emits b in x We can show that the maximum likelihood parameters (maximize P(x|)) are: Akl Ek(b) akl = ––––– ek(b) = ––––––– i AkicEk(c)
1. When the right answer is known Intuition: When we know the underlying states, Best estimate is the average frequency of transitions & emissions that occur in the training data Drawback: Given little data, there may be overfitting: P(x|) is maximized, but is unreasonable 0 probabilities – VERY BAD Example: Given 10 casino rolls, we observe x = 2, 1, 5, 6, 1, 2, 3, 6, 2, 3 = F, F, F, F, F, F, F, F, F, F Then: aFF = 1; aFL = 0 eF(1) = eF(3) = .2; eF(2) = .3; eF(4) = 0; eF(5) = eF(6) = .1
Pseudocounts Solution for small training sets: Add pseudocounts Akl = # times kl transition occurs in + rkl Ek(b) = # times state k in emits b in x + rk(b) rkl, rk(b) are pseudocounts representing our prior belief Larger pseudocounts Strong priof belief Small pseudocounts ( < 1): just to avoid 0 probabilities
Pseudocounts Example: dishonest casino We will observe player for one day, 600 rolls Reasonable pseudocounts: r0F = r0L = rF0 = rL0 = 1; rFL = rLF = rFF = rLL = 1; rF(1) = rF(2) = … = rF(6) = 20 (strong belief fair is fair) rL(1) = rL(2) = … = rL(6) = 5 (wait and see for loaded) Above #s pretty arbitrary – assigning priors is an art
2. When the right answer is unknown We don’t know the true Akl, Ek(b) Idea: • We estimate our “best guess” on what Akl, Ek(b) are • We update the parameters of the model, based on our guess • We repeat
2. When the right answer is unknown Starting with our best guess of a model M, parameters : Given x = x1…xN for which the true = 1…N is unknown, We can get to a provably more likely parameter set i.e., that increases the probability P(x | ) Principle: EXPECTATION MAXIMIZATION • Estimate Akl, Ek(b) in the training data • Update according to Akl, Ek(b) • Repeat 1 & 2, until convergence
Estimating new parameters To estimate Akl: (assume | CURRENT, in all formulas below) At each position i of sequence x, find probability transition kl is used: P(i = k, i+1 = l | x) = [1/P(x)] P(i = k, i+1 = l, x1…xN) = Q/P(x) where Q = P(x1…xi, i = k, i+1 = l, xi+1…xN) = = P(i+1 = l, xi+1…xN | i = k) P(x1…xi, i = k) = = P(i+1 = l, xi+1xi+2…xN | i = k) fk(i) = = P(xi+2…xN | i+1 = l) P(xi+1 | i+1 = l) P(i+1 = l | i = k) fk(i) = = bl(i+1) el(xi+1) akl fk(i) fk(i) akl el(xi+1) bl(i+1) So: P(i = k, i+1 = l | x, ) = –––––––––––––––––– P(x | CURRENT)
Estimating new parameters • So, Akl is the E[# times transition kl, given current ] fk(i) akl el(xi+1) bl(i+1) Akl = i P(i = k, i+1 = l | x, ) = i ––––––––––––––––– P(x | ) • Similarly, Ek(b) = [1/P(x | )]{i | xi = b} fk(i) bk(i) fk(i) bl(i+1) akl k l xi+2………xN x1………xi-1 el(xi+1) xi xi+1
The Baum-Welch Algorithm Initialization: Pick the best-guess for model parameters (or arbitrary) Iteration: • Forward • Backward • Calculate Akl, Ek(b), given CURRENT • Calculate new model parameters NEW : akl, ek(b) • Calculate new log-likelihood P(x | NEW) GUARANTEED TO BE HIGHER BY EXPECTATION-MAXIMIZATION Until P(x | ) does not change much
The Baum-Welch Algorithm Time Complexity: # iterations O(K2N) • Guaranteed to increase the log likelihood P(x | ) • Not guaranteed to find globally best parameters Converges to local optimum, depending on initial conditions • Too many parameters / too large model: Overtraining
Alternative: Viterbi Training Initialization: Same Iteration: • Perform Viterbi, to find * • Calculate Akl, Ek(b) according to * + pseudocounts • Calculate the new parameters akl, ek(b) Until convergence Notes: • Not guaranteed to increase P(x | ) • Guaranteed to increase P(x, | , *) • In general, worse performance than Baum-Welch
Higher-order HMMs • How do we model “memory” larger than one time point? • P(i+1 = l | i = k) akl • P(i+1 = l | i = k, i -1 = j) ajkl • … • A second order HMM with K states is equivalent to a first order HMM with K2 states aHHT state HH state HT aHT(prev = H) aHT(prev = T) aHTH state H state T aHTT aTHH aTHT state TH state TT aTH(prev = H) aTH(prev = T) aTTH
Modeling the Duration of States 1-p Length distribution of region X: E[lX] = 1/(1-p) • Geometric distribution, with mean 1/(1-p) This is a significant disadvantage of HMMs Several solutions exist for modeling different length distributions X Y p q 1-q
Solution 1: Chain several states p 1-p X Y X X q 1-q Disadvantage: Still very inflexible lX = C + geometric with mean 1/(1-p)
Solution 2: Negative binomial distribution Duration in X: m turns, where • During first m – 1 turns, exactly n – 1 arrows to next state are followed • During mth turn, an arrow to next state is followed m – 1 m – 1 P(lX = m) = n – 1 (1 – p)n-1+1p(m-1)-(n-1) = n – 1 (1 – p)npm-n p p p 1 – p 1 – p 1 – p Y X(n) X(1) X(2) ……
Example: genes in prokaryotes • EasyGene: Prokaryotic gene-finder Larsen TS, Krogh A • Negative binomial with n = 3
Solution 3: Duration modeling Upon entering a state: • Choose duration d, according to probability distribution • Generate d letters according to emission probs • Take a transition to next state according to transition probs Disadvantage: Increase in complexity: Time: O(D) Space: O(1) where D = maximum duration of state F d<Df xi…xi+d-1 Pf Warning, Rabiner’s tutorial claims O(D2) & O(D) increases
Viterbi with duration modeling emissions emissions Recall original iteration: VF(i) = maxk Vk(i – 1) akl eF(xi) New iteration: VF(i) = maxk maxd=1…DfVk(i – d) Pf(d) akF j=i-d+1…ieF(xj) F L d<Df d<Dl Pl Pf transitions xi…xi + d – 1 xj…xj + d – 1 Precompute cumulative values