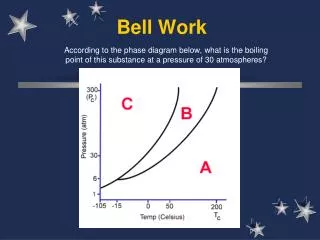
Bell Work
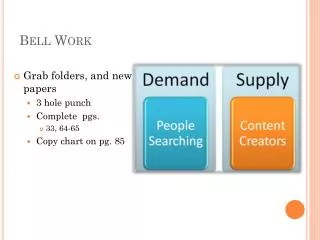
Bell Work. Grab folders, and new papers 3 hole punch Complete pgs. 33, 64-65 Copy chart on pg. 85. Unit 2: How markets Work. Chapter 4: Demand Chapter 5: Supply Chapter 6: Prices Chapter 7: Market Structure. Chapter 4 Section 1. “How do we decide what to buy?” Objectives

Bell Work
E N D
Presentation Transcript
Bell Work • Grab folders, and new papers • 3 hole punch • Complete pgs. • 33, 64-65 • Copy chart on pg. 85
Unit 2: How markets Work • Chapter 4: Demand • Chapter 5: Supply • Chapter 6: Prices • Chapter 7: Market Structure
Chapter 4 Section 1 • “How do we decide what to buy?” • Objectives • Explain Law of Demand • How substitution/income effects influence decisions • Make demand schedule for individual/market • Understand demand graph using demand schedules • Key Terms: • http://www.pearsonsuccessnet.com/snpapp/iText/products/0-13-369833-5/Flash/Ch04/Econ_OnlineLectureNotes_ch4_s1.swf
Introduction • How does the law of demand affect qty. demanded? • Price changes always affect qty. demanded b/c people buy less of a good when prices go up • By understanding demand schedules/curves you can analyze how consumers react to changes in price.
Demand • Demand is the desire to own something w/ability to pay for it • Law of Demand: • Price is down consumers buy more • Price is up, consumers buy less • Result of substitution/income effect • Together they explain why increases in price decreased purchasing
Substitution Effect • When a consumer reacts to rise in price of a good… • By….. • Consuming less of that good and more of a substitute good • Can also apply to drops in pricing
Income Effect • Change in consumption that results when a price increase causes real income to decline • Consumption measured in amount of good bought, not price • Can make you feel “richer/poorer” • Causes a person spend more/same as before but qty. is less. • Phone Apps: Example • Apps go up to $5 per, you may still buy an app or 2 but now you buy less than when they were $0.99. • Vice-versa is true as well; you will buy more or feel “wealthier” if they are less and your demand is higher
Demand Schedules: Figure 4.2 pg.89 • Explains how the price of an item affects the qty. demanded of that item • To have DEMAND you have to be willing/able to buy it at a certain price. • Schedule is a table that lists the qty a person will purchase at various prices
Individual vs. Market Schedules Individual Market • Qty. demanded at various prices by an idividual • Predicts individual qty. a person is willing to buy at prices • Shows Law of Demand • Qtys. demanded at various prices by all consumers • Predict total sales @ diff. prices • Shows Law of Demand
Demand Graph • Graphic representation of demand schedule • Vertical axis ALWAYS labeled lowest to highest prices • Horizontal axis SHOULD be labeled lowest to highest possible qty. demanded • ALL demand curves/schedules reflect Law of Demand • Limits • Only accurate for one very specific set of conditions • Cannot predict changing market conditions
Lesson Closing • Review • W/Partner: Think of a good that fits the schedules/curves we just talked about. • Create an individual/market schedule for that good • Describe if it fits substitution or income effect more. • Pg. 90 • #11 • Workbook • Complete pages 34-35, and 15
Chapter 4 Section 2 Bell Work: 1st 10 Minutes of class Grab/log on to Netbook Review W/Partner: Think of a good that fits the schedules/curves we just talked about. Create an individual/market schedule for that good Describe if it fits substitution or income effect more. Pg. 90 #11 Workbook Complete pages 34-35, and 15
Chapter 4 Section2 • “Why does the demand curve shift?” • Objectives • Difference in change in qty. demanded and shift in demand curve • Know factors that create changes in demand/cause shift in curve • Example(s) of how a change in demand in good for one good can affect demand for a related good • Key terms • http://www.pearsonsuccessnet.com/snpapp/iText/products/0-13-369833-5/Flash/Ch04/Econ_OnlineLectureNotes_ch4_s2.swf
Introduction • Why does the demand curve shift? • Caused by more than just price increases/decreases • Other factors • Income • Consumer expectations • Population • Demographics • Consumer tastes/advertising
Changes in Demand • Demand Schedule takes into account only price change • Doesn’t consider effects of news reports or many other factors that change daily • Demand curves are accurate only as long as price is the only change that affects the consumers decision • Or only as long as ceteris paribus is true • Drop cp and allow other factors to change, curve is no longer followed and a shift is produced • Shift= @ every price, consumers buy a different quantity than before; shifts entire demand curve • Heat wave/Summer Examples • What are people going to want more then?
Graphing Changes in DemandWhen factors other than price cause demand to fall, the curve shifts to the left Which graph would represent the price of a book going up $1?
Change in Demand Factors • Several factors can lead to a change in demand, rather than simply change the qty. demanded • Income • Most items we purchase are “normal goods” • As income rises we buy more of them • Rise= shift to Right, Fall= shift to left • Consumer Expectations • Current demand is positively related to its expected future price • If you expect price to rise, current demand will rise • Vice-versa w/ price drop, wait till its lower
Change in Demand Factors • Population • Size of population will also affect the demand for most products • Can have a particularly strong effect on certain goods • Computers, technology, BABY BOOM? • Demographics • Race, age, gender, and occupation of a population • Help businesses classify potential consumers • Influence packaging, pricing, and advertising • Example: Hispanics now largest minority, more advertising • Advertising/Consumer Tastes • Can play important role in trends of purchasing • Spend $$ hoping to influence buyers
Complements and substitutes • Demand curve for one good can also shift b/c response to change in demand of another good • Two types of related goods that interact this way • Complements: Goods that are bought/used together • Substitutes: Goods used in place of one another
Lesson Closing • Fill out 2 Charts from Section 1 & 2 • Finish 34-36 • Start on activities on pg. 15, 23 in workbooks • Use net-books to log on to pearson success net and look at resources for Chapter 4 1 and 2 • Action Graphs, Economics and you, visual glossary
Chapter 4 Section 3 Complete Two Bubble charts from Section 1 and 2 Copy down Concept Chart for S.3
Chapter 4 Section 3 • “What factors affect elasticity of Demand?” • Objectives • How to calculate elasticity of demand • Factors that effect elasticity • How firms use elasticity and revenue to make decisions • Key Terms • http://www.pearsonsuccessnet.com/snpapp/iText/products/0-13-369833-5/Flash/Ch04/Econ_OnlineLectureNotes_ch4_s3.swf
Introduction • What factors affect elasticity of demand? • Economists have figures a way to calculate how consumers will react to changes in price • Original price and how much you want a particular good are both factors that determine your demand for a product
Consumer Response • Elasticity of demand is the way that consumers respond to price changes • It measures how drastically buys will cut back or increase their demand for a good rises/falls • Your demand for a good that you will keep buying despite a price change is inelastic • If you buy much less of a good after a small price increase, your demand for the good is elastic
Elastic Demand • Elastic Demand comes from one or more of these factors • Availability of substitute goods • Limited budget that doesn’t allow for price changes • Perception of good as a luxury item • Calculating Elasticity of Demand • % change in qty demanded of good divided by % change in price of good • Law of demand implies that result will always be negative • Look at figure 4.5; answer 2 ?s
Measuring Elasticity • If elasticity is less than 1 it is INELASTIC • If elasticity is greater than 1 it is ELASTIC • If it is equal it is unitary elastic
Factors Affecting Elasticity • Availability of substitutes • Few substitutes • Price increase may not result in less demand • Can make good inelastic • GAS!! • Wide variety of substitutes • Price increase can result in less demand as substitutes are used. • Good is Elastic • Brand-names, food goods, designer clothing, etc.
Other factors for elasticity • Relative importance • How much of your budget you are willing to spend on a good • Necessities v. Luxuries • Whether or not good is considered a necessity or luxury affects elasticity of demand for good • Some people deem their phone a necessity now, others a luxury • Change over time • Can’t always react quickly to price increase • Often caused by time to find substitutes • Demand is then INELASTIC short-term but eventually ELASTIC • Ex.: Gas guzzling SUVs are now being replaced.
How firms use elasticity/Revenue • Elasticity=important to economics b/c helps measure how consumers respond to changes for different product • Elasticity of demand determines how a change in price will affect income/revenue of a firm (figure 4.6) • Law of demand states that an increase in price will decrease qty demanded • Elastic demand; you can raise the price by __% and demand could decrease by larger %= reduced revenue • Vice-versa: Can decrease price by __% and demand could increase by larger %= increased revenue • Look/Answer 4.6 on 103
Elasticity and Revenue Cont’d • Demand =Inelastic • Consumers don’t respond much to price change • EX: if price increases, qty demand will but less than price increase • Results in higher revenues (GAS) • Elasticity of Demand determines effect of a price change on total revenue • Why will revenue fall if firm raises price of elastic good? • Demand decreases by a larger % than price increases, decrease in revenue • What happens to revenue when price decrease, but demand is inelastic? • Decreases
Lesson Closing • Test Monday • Study Guide/Work Day tomorrow Closing options • Work on projects w/partner • Workbook work due on Monday w/ test • 33-40, 15, 23, 28