Genes and Expression
Genes and Expression. 51:123 Terry Braun. Today's Outline. Gene structure genomic structure vs mRNA structure ESTs coding and noncoding exons introns primary transcript processing memory pneumonic alternative splicing and differential polyadenylation. Genome (3 Bb) – zoom in. Adenine

Genes and Expression
E N D
Presentation Transcript
Genes and Expression 51:123 Terry Braun
Today's Outline • Gene structure • genomic structure vs mRNA structure • ESTs • coding and noncoding exons • introns • primary transcript processing • memory pneumonic • alternative splicing and differential polyadenylation
Genome (3 Bb) – zoom in Adenine Thymine Guanine Cytosine ATGC purines AG pyrimidines CT www.ensembl.org
Central Dogma • gene – portions of a genome that affect the transcription, translation, and expression of functionally active molecules (proteins, DNA [promoters] rRNA, mRNA, tRNA, etc) • gene – often used to describe the “coding” regions of genomes – the portions of DNA that are “made” into a protein (via transcription, and translation) • DNA -> pre-mRNA -> mRNA -> protein
Central Dogma • DNA -> pre-mRNA -> mRNA -> protein • DNA is “transcribed” into pre-mRNA • “introns” are removed • lariat structure • “exons” remain (“spliced together”), also called the “coding regions” – called mRNA • splice site junctions • mRNA is “translated” into protein
Schellenberg MJ, Ritchie DB, MacMillan AM. Pre-mRNA splicing: a complex picture in higher definition. Trends Biochem Sci. 2008 Jun;33(6):243-6. Epub 2008 May 9. Review.
Example of Gene in Genomic Context Context of gene – BBS4 – in the human genome. Scale = 72.28 Kb Exons and introns Note possible upstream gene, on other strand Less than 3% of the genome is transcribed and translated into a protein.
Human Genome Project • Problem • How do you find all of the genes in a sea of DNA?
Where’s the gene? >BBS4 exon2 TAAAGTAACTCTATCACAATATGGATTTAATGGATTAATTGCATAATTGGTGAGCTACTG ATTATTCTTGTTATTTGGATGCTTCTTTAAGTTAGCAAGTTTATATTGTGGTGCTTCAAT ATAGACTACTTATTTCATTTCAGAGAACTCAATTTCCTGTATCTACTGAGTCTCAAAAAC CCCGGCAGAAAAAAGGTCTGTATGCAGTTTCATGGTATGTGTATGTTTGCACAGACAGAT TTCTCTTTTATTTATTTATTTATTTTTTTTTTTGGAGGCAGAGTCTCACTGTCACCCAGG CTGGAGTGCAGTAGCACAATCTTGGCTCACTGCAACCTTTGCCTCTGGGGCTCAAGCAAT TCTCCTGCCTCAGCCTCCCGAGTAGCTGGGATTACAGGTGCACGCCACCACACCTGGCTA
Where’s the gene? >BBS4 exon2 TAAAGTAACTCTATCACAATATGGATTTAATGGATTAATTGCATAATTGGTGAGCTACTG ATTATTCTTGTTATTTGGATGCTTCTTTAAGTTAGCAAGTTTATATTGTGGTGCTTCAAT ATAGACTACTTATTTCATTTCAGAGAACTCAATTTCCTGTATCTACTGAGTCTCAAAAAC CCCGGCAGAAAAAAGGTCTGTATGCAGTTTCATGGTATGTGTATGTTTGCACAGACAGAT TTCTCTTTTATTTATTTATTTATTTTTTTTTTTGGAGGCAGAGTCTCACTGTCACCCAGG CTGGAGTGCAGTAGCACAATCTTGGCTCACTGCAACCTTTGCCTCTGGGGCTCAAGCAAT TCTCCTGCCTCAGCCTCCCGAGTAGCTGGGATTACAGGTGCACGCCACCACACCTGGCTA
ESTs • Expressed Sequence Tags • If we could read the sequence at only the front (5') or end(3') of mRNAs (transcripts), or even in the middle, that would be conclusive evidence of a gene • Uniquely (?) identify all of the genes • Do not have full expense of sequencing the whole gene sequence (100's of nucleotides VS 1000's) • Can observe differences of expression in tissues • Many questioned whether the complete genome should even be sequenced
ESTs at Iowa • Approach • Harvest mRNAs and sequence them • Subtract out what you have already seen (serial subtraction) • Rat gene discovery at Iowa (2003) • 233,890 3-prime ESTs, 50,075 5-prime ESTs • 57,822 clusters (8/26/2003) • novelty = 57,822/(233,890 + 50,075) = 0.20
C-Value ParadoxHartl, “Molecular melodies in high and low C,” Nat. Rev. Genetics, Nov 2001 • refers to the massive, counterintuitive and seemingly arbitrary differences in genome size observed in eukaryotic organisms • Drosophila melanogaster 180 Mb • Podisma pedestris 18,000 Mb • difference is difficult to explain in view of apparently similar levels of evolutionary, developmental, and behavioral complexity • more to a genome than coding sequences • example – Alu repeats ~ 250 nucleotides • humans, chimps, gorillas • Not in rat/mouse
Repetitive Elements LINEs 20.4% 868,000 SINEs 13.4 1,558,000 alus 10.6 1,090,000 transposons 2.8 294,000 Sudbery 2002 Human Mol Genetics number elements
Alternative Splicing Every conceivable pattern of alternative splicing is found in nature. Exons have multiple 5’ or 3’ splice sites alternatively used (a, b). Single cassette exons can reside between 2 constitutive exons such that alternative exon is either included or skipped ( c ). Multiple cassette exons can reside between 2 constitutive exons such that the splicing machinery must choose between them (d). Finally, introns can be retained in the mRNA and become translated. Graveley, “Alternative splicing: increasing diversity in the proteomic world.” Trends in Genetics, Feb., 2001.
Each amino acid contains an "amine" group (NH3) and a "carboxy" group (COOH) (shown in black in the diagram).The amino acids vary in their side chains (indicated in blue in the diagram).The eight amino acids in the orange area are nonpolar/ hydrophobic.The other amino acids are polar/ hydrophilic ("water loving").The two amino acids in the purple box are acidic ("carboxy" group in the side chain).The three amino acids in the blue box are basic ("amine" group in the side chain). Know relationship between DNA, mRNA, and aa’s Relevance to disease: changes L to I? Cysteine and disulfide bonds nonpolar: internal, polar: external (interacts with H20)
A ala alanine M met methionine • C cys cysteine N asn aspargine • D asp aspartic acid P pro proline • E glu glutamic acid Q gln glutamine • F phe phenylalanine R arg arginine • G gly glycine S ser serine • H his histidine T thr threonine • I ile isoleucine V val valine • K lys lysine W trp tryptophane • L leu leucine Y tyr tyrosine
Review Codon Table degenerate code gene prediction One codon: Met, Trp. Two codons: Asn, Asp, Cys, Gln, Glu, His, Lys, Phe, Tyr, Three codons: Ile, STOP ("nonsense"). Four codons: Ala, Gly, Pro, Thr, Val. Five codons: none. Six codons: Arg, Leu, Ser.
Mutations • Mis-sense • Non-sense • www.hgvs.org • http://www.hgvs.org/mutnomen/
From Slide 6… ATG CCC TTC TCC AAC AGC GT -- splice donor M P F S N S CCT GCC CCC CAT GCC TGA P A P H A STOP Delete CC ATG CCC TTC TAA CAG CCC M P F Stop Q P TGC CCC CCA TGC CTG AGG GGC C P P C L R G …?
Codon Bias • PAM1 (Point Accepted Mutations) Dayhoff 1978 • global alignment of closely related proteins (85% identical) • <= 1% divergence between proteins • Blosum62 (Blocks Substitution Matrix) Henikoff 1992 • proteins across species containing “blocks” of homology with at least 62 percent were compared • a residue change measurement was computed based on observed residue changes • rare change = -4 • common change = 11
# Matrix made by matblas from blosum62.iij # * column uses minimum score # BLOSUM Clustered Scoring Matrix in 1/2 Bit Units # Blocks Database = /data/blocks_5.0/blocks.dat # Cluster Percentage: >= 62 # Entropy = 0.6979, Expected = -0.5209 A R N D C Q E G H I L K M F P S T W Y V B Z X * A 4 -1 -2 -2 0 -1 -1 0 -2 -1 -1 -1 -1 -2 -1 1 0 -3 -2 0 -2 -1 0 -4 R -1 5 0 -2 -3 1 0 -2 0 -3 -2 2 -1 -3 -2 -1 -1 -3 -2 -3 -1 0 -1 -4 N -2 0 6 1 -3 0 0 0 1 -3 -3 0 -2 -3 -2 1 0 -4 -2 -3 3 0 -1 -4 D -2 -2 1 6 -3 0 2 -1 -1 -3 -4 -1 -3 -3 -1 0 -1 -4 -3 -3 4 1 -1 -4 C 0 -3 -3 -3 9 -3 -4 -3 -3 -1 -1 -3 -1 -2 -3 -1 -1 -2 -2 -1 -3 -3 -2 -4 Q -1 1 0 0 -3 5 2 -2 0 -3 -2 1 0 -3 -1 0 -1 -2 -1 -2 0 3 -1 -4 E -1 0 0 2 -4 2 5 -2 0 -3 -3 1 -2 -3 -1 0 -1 -3 -2 -2 1 4 -1 -4 G 0 -2 0 -1 -3 -2 -2 6 -2 -4 -4 -2 -3 -3 -2 0 -2 -2 -3 -3 -1 -2 -1 -4 H -2 0 1 -1 -3 0 0 -2 8 -3 -3 -1 -2 -1 -2 -1 -2 -2 2 -3 0 0 -1 -4 I -1 -3 -3 -3 -1 -3 -3 -4 -3 4 2 -3 1 0 -3 -2 -1 -3 -1 3 -3 -3 -1 -4 L -1 -2 -3 -4 -1 -2 -3 -4 -3 2 4 -2 2 0 -3 -2 -1 -2 -1 1 -4 -3 -1 -4 K -1 2 0 -1 -3 1 1 -2 -1 -3 -2 5 -1 -3 -1 0 -1 -3 -2 -2 0 1 -1 -4 M -1 -1 -2 -3 -1 0 -2 -3 -2 1 2 -1 5 0 -2 -1 -1 -1 -1 1 -3 -1 -1 -4 F -2 -3 -3 -3 -2 -3 -3 -3 -1 0 0 -3 0 6 -4 -2 -2 1 3 -1 -3 -3 -1 -4 P -1 -2 -2 -1 -3 -1 -1 -2 -2 -3 -3 -1 -2 -4 7 -1 -1 -4 -3 -2 -2 -1 -2 -4 S 1 -1 1 0 -1 0 0 0 -1 -2 -2 0 -1 -2 -1 4 1 -3 -2 -2 0 0 0 -4 T 0 -1 0 -1 -1 -1 -1 -2 -2 -1 -1 -1 -1 -2 -1 1 5 -2 -2 0 -1 -1 0 -4 W -3 -3 -4 -4 -2 -2 -3 -2 -2 -3 -2 -3 -1 1 -4 -3 -2 11 2 -3 -4 -3 -2 -4 Y -2 -2 -2 -3 -2 -1 -2 -3 2 -1 -1 -2 -1 3 -3 -2 -2 2 7 -1 -3 -2 -1 -4 V 0 -3 -3 -3 -1 -2 -2 -3 -3 3 1 -2 1 -1 -2 -2 0 -3 -1 4 -3 -2 -1 -4 B -2 -1 3 4 -3 0 1 -1 0 -3 -4 0 -3 -3 -2 0 -1 -4 -3 -3 4 1 -1 -4 Z -1 0 0 1 -3 3 4 -2 0 -3 -3 1 -1 -3 -1 0 -1 -3 -2 -2 1 4 -1 -4 X 0 -1 -1 -1 -2 -1 -1 -1 -1 -1 -1 -1 -1 -1 -2 0 0 -2 -1 -1 -1 -1 -1 -4 * -4 -4 -4 -4 -4 -4 -4 -4 -4 -4 -4 -4 -4 -4 -4 -4 -4 -4 -4 -4 -4 -4 -4 1
Expression • A gene is expressed when the DNA sequence in the genome is transcribed into an mRNA molecule, and that mRNA molecule is correctly made into a protein (aka. string of amino acids for polypeptide). • Note that evaluation of expression is often done by examining/counting the amount/number of mRNA molecules made by the cells of a particular tissue.
DNA/RNA/Protein and Strands • promoters • anywhere from 1 to 10 KB to ??? upstream of a gene • many proteins and other molecules (RNAs) involved • largely unknown • “promoter bashing” • replace or delete regions of DNA in promoter • measure level of expression • trans- and cis- regulatory elements • trans – not co-localized to the gene • cis – generally localized to the gene
Example -- LCR An example of the functional potential for non-coding regions is the locus control region of the opsin gene cluster (Nathans, et. al. 1989) shown to cause 50% of the cases of blue cone monochromacy. The locus control region is approximately 4 kilobases upstream of the red opsin gene, and 43 kilobases upstream of the green opsin gene. The 579 base region was mapped to the X-chromosome using observed deletions upstream of the red-green opsin gene cluster in individuals with blue cone monochromacy. Blue cone monochromatism is characterized by poor central vision and color discrimination and nearly normal retinal appearance.
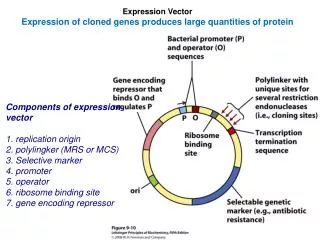
Microarray Technology • No genomics discussion would be complete without describing microarray technology. • A powerful tool for genetic research which utilizes nucleic acid hybridization techniques and recent advancements in computing technology to evaluate the mRNA expression profile of thousands of gene in one single experiment. • It has proven to be an extremely valuable method to better utilize the enormous amount of information provided by the completion of the human Genome Project.
Gene Expression: Motivation Pattern of gene expression in a cell is characteristic of its current state Virtually all differences in cell state or type can be correlated with differences in mRNA expression levels Expression patterns can provide clues to gene function and metabolic pathway architecture
Potential Impact Preventative medicine Subtype diseases in order to design better drugs for a specific genotype More targeted drug treatment -- treat disease rather than symptoms
Steps involved in Designing Microarray Experiment • Preparation of fluorescently labeled target from RNA isolated from the biological sample (aka biological sample). • Hybridization of the labeled target to the microarray. • Washing, staining, and scanning of the array. • Analysis of the scanned image. • Generation of gene expression profiles.
DNA Array Technology cDNA libraries and/or gene sequence data Cell Lines RNA Hybridization Surface Target Probe Data Acquisition Expression Levels Analysis
Microarray Experiment 326 Rat Heart Genes, 2x spotting
Hybridization/Microarray Tech. • Very large scale • multiples of 1K density for glass slides • cheap • custom • considered not as reliable • Affy – U133 • 2 chips • 45,000 probe sets • 39,000 transcripts • 33,000 genes • SNP chip • 11,500 SNPs (single nucleotide polymorphisms, or genotypes) • 100,000 SNPs (another year?) • Research and funding dilemma • NIH sponsored funding • only distilled data (if that) made available • confidentiality issues
Examples of Analysis • simple filter • all up, all down • clustering • Eisen diagrams • volcano plots • Mootha approach
Polyadenylation (Poly-A) • The addition of multiple adenines to a pre-mRNA and is part of the end of the transcription process • Three steps • 1) the RNA strand is cleaved at a particular site • 2) the addition of poly-A's to the 3' end • 3) the degradation of the remainder of the RNA transcript
Polyadenylation Cut polyadenylated degraded AAAn
Poly-A Signal AAUAAA – specifies where the mRNA is cleaved, and the Poly-A is added Typically 23 or 24 bases downstream of this signal 10-200 A's added Increases translatability by about 20-fold (mechanism unknown). Also thought to improve stability – protecting the end of the mRNA molecule from exonucleases.
Alternative Polyadenylation • common in human RNA (Edwards-Gilbert 1997) • in many genes, 2 or more poly-A signals in 3’ UTR • alternative transcripts can show tissue specificity • alternative poly-A signals may be brought into play following alternative splicing