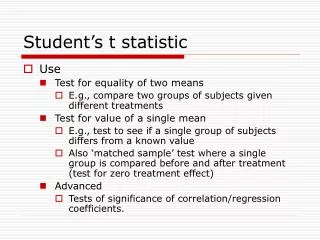
Calculate t-statistic
Calculate t-statistic. 19.16

Calculate t-statistic
E N D
Presentation Transcript
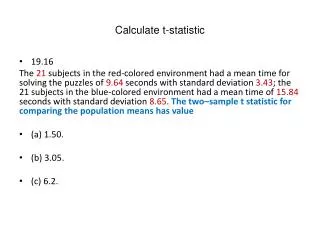
Calculate t-statistic • 19.16 The 21 subjects in the red-colored environment had a mean time for solving the puzzles of 9.64 seconds with standard deviation 3.43; the 21 subjects in the blue-colored environment had a mean time of 15.84seconds with standard deviation 8.65. The two–sample t statistic for comparing the population means has value • (a) 1.50. • (b) 3.05. • (c) 6.2.
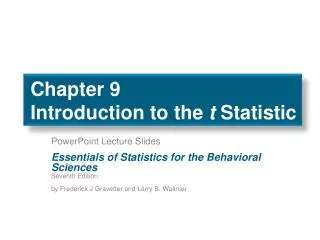
Coaching and SAT scores • 19.26 Coaching and SAT scores, continued. What we really want to know is whether coached students improve more than uncoached students, and whether any advantage is large enough to be worth paying for. Use the information in the previous exercise to answer these questions: • (a) Is there good evidence that coached students gained more, on the average, than uncoached students? • Hint: H0: μ1 = μ2, Ha: μ1 > μ2 • Calculate two–sample t statistic: • Df = ? • Using Table C find the p-value