Download
1 / 13
130 likes | 258 Vues
Introduction to the t statistic. Steps to calculate the denominator for the t-test. 1. Calculate variance or SD s 2 = SS/n-1 2. Calculate the standard error. T-test Procedure. Set the hypotheses (null and alternative)

E N D
Steps to calculate the denominator for the t-test 1. Calculate variance or SD s2= SS/n-1 2. Calculate the standard error
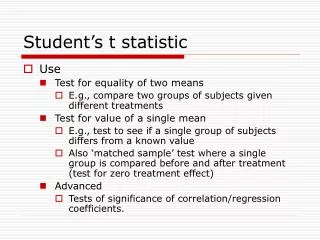
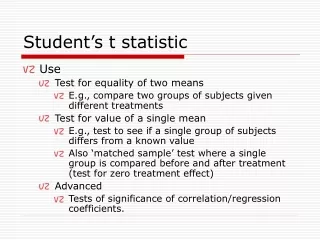
T-test Procedure Set the hypotheses (null and alternative) Set the decision criteria (by selecting the alpha level, directionality, and critical values). Compute the test-statistic (t) Compare obtained t-statistic to critical value(s) Make a statistical decision Concluding statement
Conducting a t-test It’s not a normal distribution, and you don’t use the unit normal table Using the t-distribution (William Sealy Gosset, 1908) instead
T-distribution Bell-shaped and symmetrical A ‘family’ of distributions - depends on the degrees of freedom The mean of the t-distribution is zero
T-distribution table • When the df is NOT listed in the table provided in Appendix B, you should look up the critical t for both of the surrounding df values listed and use the LARGER value for t
Measuring Effect Size with the t Statistic (cont.) • Estimated Cohen’s d
Measuring Effect Size with the t Statistic (cont.) • percentage of variance accounted for = r2 (aka 2)
Assumptions for a One-sample t-Test 1. Independent observations 2. The sample data come from a normal population distribution
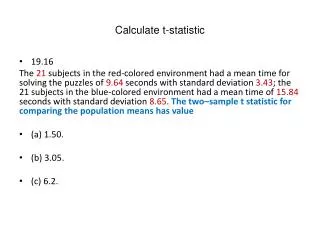
Example 1 • The legal highway limit near populated areas in many parts of the US is 55 mph. To determine whether people exceed the 55mph, suppose a state monitored the speeds of 25 cars at selected highway locations. Can we conclude that the average speed is higher than the 55 mph limit?
Example 1 - Data 55 60 60 55 57 60 55 58 63 54 65 56 61 58 55 57 59 53 59 65 56 61 55 54 59 Find the following: • Mean • SS • s2 • s