Download
1 / 13
130 likes | 290 Vues
Chapter 9 Introduction to the t Statistic. 9.1 Review Hypothesis Testing with z- Scores. Sample mean ( M ) estimates (& approximates) population mean ( μ ) Standard error describes …. z -Score Statistic. Use z -score statistic to quantify inferences about the population.

E N D
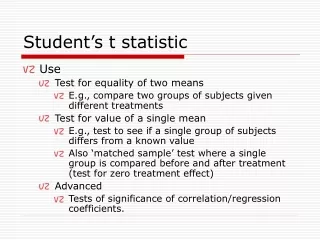
9.1 Review Hypothesis Testing with z-Scores • Sample mean (M) estimates (& approximates) population mean (μ) • Standard error describes …
z-Score Statistic • Use z-score statistic to quantify inferences about the population. • Use z-table to find the critical region of z-scores
Problem with z-Scores • The z-score requires more information than researchers typically have available • Requires knowledge of the … • Researchers usually have only the …
Introducing the t Statistic • t statistic is an alternative to z • Estimated standard error (sM) is used as in place of the real standard error when …
Estimated standard error • Use s2 to estimate σ2 • Estimated standard error: • Estimated standard error is used as estimate of the real standard error when the …
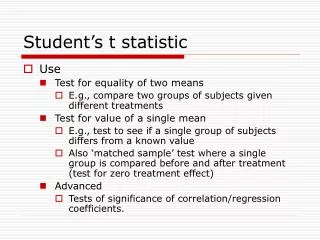
The t-Statistic • The t-statistic uses the estimated standard error in place of σM • The t statistic is used to test hypotheses about an unknown population mean μ when the value of σ is unknown
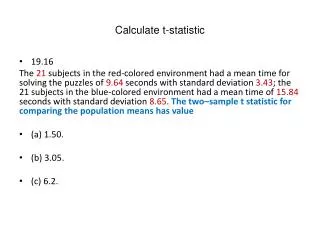
9.2 Hypothesis tests with the t statistic • The one-sample t test statistic
Hypothesis Testing: Four Steps • State the null and alternative hypotheses andselect an alpha level • Locate critical region using t table and df • Calculate the t test statistic • Make a decision regarding H0 (null hypothesis)
Assumptions of the t test • Values in the sample are … • The population sampled must be …
9.3 Measuring Effect Size • Hypothesis test determines whether the treatment effect is greater than chance • No measure of the size of the effect is included • A very small treatment effect can be statistically significant • Therefore, results from a hypothesis test should be accompanied by a measure of effect size
Cohen’s d • Original equation included population parameters • Estimated Cohen’s d is computed using the sample standard deviation
Percentage of variance explained • Determining the amount of variability in scores explained by the treatment effect is an alternative method for measuring effect size. • r2 = 0.01 small effect • r2 = 0.09 medium effect • r2 = 0.25 large effect