Carbon & Power Accounting in Data Centre: The CARBS Project
160 likes | 255 Vues
This study delves into accounting for carbon emissions and power consumption in data centers, exploring challenges, learning outcomes, project aims, and practical solutions. Employs real-time environmental monitoring and cost analysis to optimize IT services.

Carbon & Power Accounting in Data Centre: The CARBS Project
E N D
Presentation Transcript
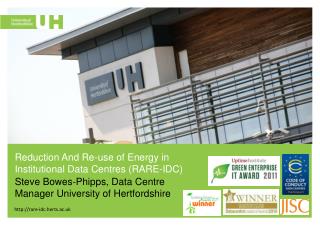
How Much? A study into accounting for Carbon and power in the Data Centre Steve Bowes-Phipps Data Centre Manager University of Hertfordshire http://rare-idc.herts.ac.uk
How Much? A study into accounting for Carbon and power in the Data Centre What? & When? Business Drivers The CARBS Project Challenges Learning Outcomes Summing Up
How Much? A study into accounting for Carbon and power in the Data Centre Business Drivers • The project supports the following UH initiatives: • The Carbon Management Plan • KPIs for Sustainability • Green ICT Strategy • HEFCE encouragement to reduce Carbon footprint • Need to minimise IT operational costs • Making best use of existing scarce resources • Assessments of cloud computing versus running services in-house are required for all new service acquisitions/replacements • Lack of a framework to refer to • Understanding what is driving power usage within the university’s data centres • Can service users help to reduce our Carbon Footprint? • Providing capacity planning data for future data centre requirements
How Much? A study into accounting for Carbon and power in the Data Centre The Carbon Accounting & Reporting of Baselines for Services Project (CARBS) 12 month project funded by JISC 2012-2013 Working with Concurrent Thinking Employs inexpensive hardware Makes use of internal server system metrics (where available) Accurate measurement of power usage within systems and across hardware domains Create a real-time environmental dashboard for individual services and the data centre(s) as a whole
How Much? A study into accounting for Carbon and power in the Data Centre The CARBS Project • Aims & Objectives: • Hardware and software model for providing real-time financial & carbon costing of two or more internally delivered IT services • Comparisons of output from JISC baselining resources and actual results as calculated by the project • A report on the experiences of power & carbon cost accounting for services and its comparability to the costs of external service provision through the cloud • Public blog tracking the path through the project and learning along the way • Presentation(s) to the JISC community • To work with the JISC community and wider sector to share the experiences and approaches to assist other organisations to benchmark, further develop carbon cost accounting approaches for IT services
How Much? A study into accounting for Carbon and power in the Data Centre Challenges No such thing as a “simple” service anymore Not all systems follow the rules Different communications protocols (MODBUS, SNMP) DCIM products are immature and constantly evolving False economies: you get what you pay for! Operational processes can be an obstacle to implementing service monitoring
How Much? A study into accounting for Carbon and power in the Data Centre Apportioning the Cost of the SAN • Meter the PDUs in the cabs that house the SAN • Get the disk allocation for the Service • Get the total allocated capacity of SAN • Meter the actual Service used storage of its full allocation • Get the unallocated storage of the SAN • Calculation will be: (1*4/3)+(1/(2/3*5)) • The total operational cost is a function of the ratio of disk storage in use by the service against that allocated elsewhere + the ratio of unallocated storage to that allocated to the service • In English: • We know how much storage is in the SAN, but we are only interested in what is being used for the service we are trying to meter. We have storage that is in use by the service and can be costed and we have spare capacity on the SAN that is powered up but not in use by any service
How Much? A study into accounting for Carbon and power in the Data Centre Learning • Pre-Project • More difficult than it looks! • Prototype • Scope project out carefully • Is everything SNMP-enabled/compatible? • MIBS • Do you have them? • Check dependencies • Research OIDS • Take a full audit of your data centre • Make any changes beforehand
How Much? A study into accounting for Carbon and power in the Data Centre Learning • During the Project • Keep Stakeholders informed • Manage changes • Work closely with your DCIM vendor
How Much? A study into accounting for Carbon and power in the Data Centre Learning • Post-Project • Manage changes to the data centre • Check validity of reported values regularly • Keep Stakeholders informed • Build SNMP compatility and functionality into future procurement requirements • Don’t have a DCIM? • SusteIT’s Carbon Footprinting Tool can be made even better: • Use PUE to provide facility overhead • Add in Carbon cost to get a true picture • Don't trust the server estimators, test one of each type of server and use this base data to provide your wattage figures
How Much? A study into accounting for Carbon and power in the Data Centre Outcomes • Achievements • Complete carbon and power cost accounting for the Voyager book-lending system • Better awareness of the value of virtualising or replacing servers • Better informed as to cost comparison between cloud and in-house • Successful implementation of the infrastructure required to provide carbon and cost accounting for most services within the university’s data centres • Increased awareness of sustainability efforts at the university • Increased focus on carbon costing during project initiation process • A specific assessment of SusteIT’s carbon footprinting benchmarking tool against real-world data • Learning documented throughout the project in our blog (http://blogs.herts.ac.uk/carbs/)
How Much? A study into accounting for Carbon and power in the Data Centre Voyager Dashboard
How Much? A study into accounting for Carbon and power in the Data Centre Outcomes • Achievements • Complete carbon and power cost accounting for the Voyager book-lending system • Better awareness of the value of virtualising or replacing servers • Better informed as to cost comparison between cloud and in-house • Successful implementation of the infrastructure required to provide carbon and cost accounting for most services within the university’s data centres • Increased awareness of sustainability efforts at the university • Increased focus on carbon costing during project initiation process • A specific assessment of SusteIT’s carbon footprinting benchmarking tool against real-world data • Learning documented throughout the project in our blog (http://blogs.herts.ac.uk/carbs/)
How Much? A study into accounting for Carbon and power in the Data Centre Outcomes • Drawbacks • Large number of assumptions in model • Reliance on rack PDU data creates problems if they are not fully functional • A specific assessment of SusteIT’s carbon footprinting benchmarking tool against real-world data • Increased awareness of sustainability efforts at the university • Increased focus on carbon costing during project initiation process • Learning documented throughout the project in our blog (http://blogs.herts.ac.uk/carbs/)
How Much? A study into accounting for Carbon and power in the Data Centre Summing Up • The Voyager service cost is composed of the following elements: • Power from the PDUs in the rack where Voyager is located • A proportion of the power taken from the PDUs where the SAN storage is located • A proportion of the facility power, based on the PUE and the share of power required for 1 & 2 above • Carbon cost for the power consumed • Specifically excluded: • The network • Interesting Note: • Server at very low loading but consuming almost twice Oracle’s estimated power draw
How Much? A study into accounting for Carbon and power in the Data CentreBlogs: http://blogs.herts.ac.uk/carbs/http://blogs.herts.ac.uk/rare-idc/SusteIT’sICT Energy & Carbon Footprinting Toolhttp://www.susteit.org.uk/files/category.php?catID=4Thank YouAny Questions?