Download
1 / 1
10 likes | 101 Vues
Study on charged nanoparticles interactions in water, analyzing cluster formation based on charge levels and nanoparticle behavior on surfaces using molecular dynamics simulations.

E N D
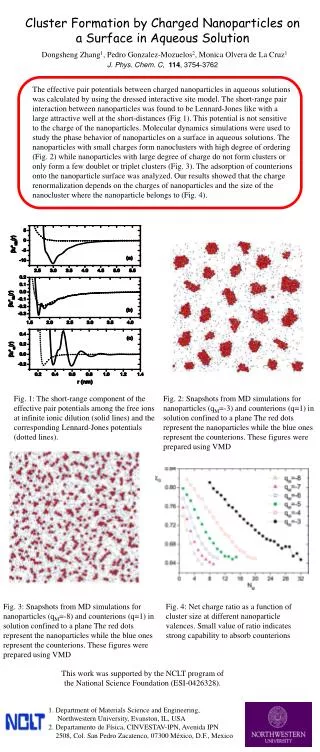
The effective pair potentials between charged nanoparticles in aqueous solutions was calculated by using the dressed interactive site model. The short-range pair interaction between nanoparticles was found to be Lennard-Jones like with a large attractive well at the short-distances (Fig 1). This potential is not sensitive to the charge of the nanoparticles. Molecular dynamics simulations were used to study the phase behavior of nanoparticles on a surface in aqueous solutions. The nanoparticles with small charges form nanoclusters with high degree of ordering (Fig. 2) while nanoparticles with large degree of charge do not form clusters or only form a few doublet or triplet clusters (Fig. 3). The adsorption of counterions onto the nanoparticle surface was analyzed. Our results showed that the charge renormalization depends on the charges of nanoparticles and the size of the nanocluster where the nanoparticle belongs to (Fig. 4). Cluster Formation by Charged Nanoparticles on a Surface in Aqueous SolutionDongsheng Zhang1, Pedro Gonzalez-Mozuelos2, Monica Olvera de La Cruz1J. Phys. Chem. C, 114, 3754-3762 Fig. 1: The short-range component of the effective pair potentials among the free ions at infinite ionic dilution (solid lines) and the corresponding Lennard-Jones potentials (dotted lines). Fig. 2: Snapshots from MD simulations for nanoparticles (qM=-3) and counterions (q=1) in solution confined to a plane The red dots represent the nanoparticles while the blue ones represent the counterions. These figures were prepared using VMD Fig. 3: Snapshots from MD simulations for nanoparticles (qM=-8) and counterions (q=1) in solution confined to a plane The red dots represent the nanoparticles while the blue ones represent the counterions. These figures were prepared using VMD Fig. 4: Net charge ratio as a function of cluster size at different nanoparticle valences. Small value of ratio indicates strong capability to absorb counterions This work was supported by the NCLT program of the National Science Foundation (ESI-0426328). 1. Department of Materials Science and Engineering, Northwestern University, Evanston, IL, USA 2. Departamento de Física, CINVESTAV-IPN, Avenida IPN 2508, Col. San Pedro Zacatenco, 07300 México, D.F., Mexico