Download
1 / 1
10 likes | 136 Vues
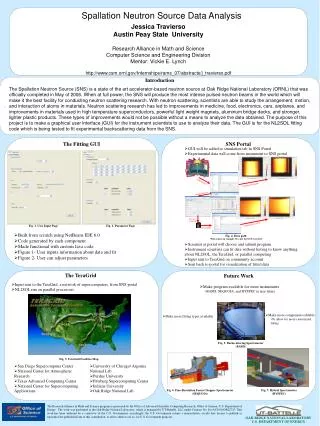
Jessica Travierso Austin Peay State University Research Alliance in Math and Science Computer Science and Engineering Division Mentor: Vickie E. Lynch http://www.csm.ornl.gov/Internships/rams_07/abstracts/j_travierso.pdf. Spallation Neutron Source Data Analysis. Introduction

E N D
Jessica Travierso Austin Peay State University Research Alliance in Math and Science Computer Science and Engineering Division Mentor: Vickie E. Lynch http://www.csm.ornl.gov/Internships/rams_07/abstracts/j_travierso.pdf Spallation Neutron Source Data Analysis Introduction The Spallation Neutron Source (SNS) is a state of the art accelerator-based neutron source at Oak Ridge National Laboratory (ORNL) that was officially completed in May of 2006. When at full power, the SNS will produce the most intense pulsed neutron beams in the world which will make it the best facility for conducting neutron scattering research. With neutron scattering, scientists are able to study the arrangement, motion, and interaction of atoms in materials. Neutron scattering research has led to improvements in medicine, food, electronics, cars, airplanes, and improvements in materials used in high temperature superconductors, powerful light weight magnets, aluminum bridge decks, and stronger, lighter plastic products. These types of improvements would not be possible without a means to analyze the data obtained. The purpose of this project is to make a graphical user interface (GUI) for the instrument scientists to use to analyze their data. The GUI is for the NL2SOL fitting code which is being tested to fit experimental backscattering data from the SNS. . The Fitting GUI SNS Portal • GUI will be added to simulation tab in SNS Portal • Experimental data will come from instrument to SNS portal Data to portal Visualize from portal Choose resource Run on TeraGrid TeraGrid Community Account Visualize from portal Fig. 1. User Input Page Fig. 2. Parameter Page Data to portal • Built from scratch using NetBeans IDE 6.0 • Code generated by each component • Made functional with custom Java code • Figure 1- User inputs information about data and fit • Figure 2- User can adjust parameters Fig. 4. Data path *This is just an example. It is not the GUI I created. • Scientist at portal will choose and submit program • Instrument scientists can fit data without having to know anything about NL2SOL, the TeraGrid, or parallel computing • Input sent to TeraGrid on community account • Sent back to portal for visualization of fitted data The TeraGrid Future Work • Input sent to the TeraGrid, a network of supercomputers, from SNS portal • NL2SOL run on parallel processors • Make program available for more instruments • BASIS, SEQUOIA, and HYSPEC in near future • Make more components editable • To allow for more customized fitting • Make more fitting types available Fig. 5. Backscattering Spectrometer (BASIS) Fig. 3. TeraGrid Facilities Map • San Diego Supercomputer Center • National Center for Atmospheric Research • Texas Advanced Computing Center • National Center for Supercomputing Applications • University of Chicago/ Argonne National Lab • Purdue University • Pittsburg Supercomputing Center • Indiana University • Oak Ridge National Lab Fig. 6. Fine-Resolution Fermi Chopper Spectrometer (SEQUOIA) Fig. 7. Hybrid Spectrometer (HYSPEC) The Research Alliance in Math and Science program is sponsored by the Office of Advanced Scientific Computing Research, Office of Science, U.S. Department of Energy. The work was performed at the Oak Ridge National Laboratory, which is managed by UT-Battelle, LLC under Contract No. De-AC05-00OR22725. This work has been authored by a contractor of the U.S. Government, accordingly, the U.S. Government retains a nonexclusive, royalty-free license to publish or reproduce the published form of this contribution, or allow others to do so, for U.S. Government purposes. OAK RIDGE NATIONAL LABORATORY U.S. DEPARTMENT OF ENERGY