Download
1 / 21
220 likes | 256 Vues
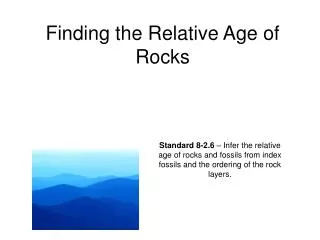
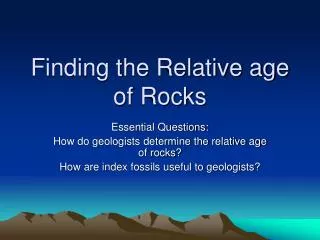
Learn how to determine the age of rock layers using Sedimentary Superposition, Radioactive Dating, Geologic Eras, Fossil Records, and more in this comprehensive guide.

E N D
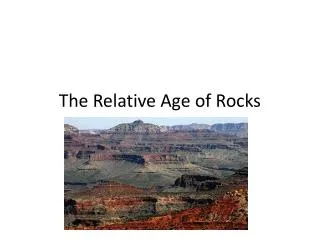
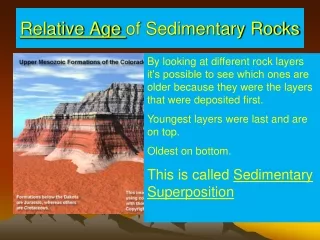
Relative Age of Sedimentary Rocks By looking at different rock layers it’s possible to see which ones are older because they were the layers that were deposited first. Youngest layers were last and are on top. Oldest on bottom. This is called Sedimentary Superposition
Sedimentary Superposition • Where are the oldest rock layers? • Why? • Can Radioactive dating can be used to prove this.
- The Fossil Record Radioactive Decay • The half life of potassium-40, a radioactive element, is 1.3 billion years. This means that half of the potassium-40 in a sample will break down into argon-40 every 1.3 billion years. The graph shows the breakdown of a 1-gram sample of potassium-40 into argon-40 over billions of years.
The red line represents the amount of potassium-40. The blue line represents the amount of argon-40. Reading Graphs: What does the red line represent? What does the blue line represent? - The Fossil Record Radioactive Decay
Potassium-40–100%; argon-40–0% Reading Graphs: At 2.6 billion years ago, how much of the sample consisted of potassium-40? How much of the sample consisted of argon-40? - The Fossil Record Radioactive Decay
About 1.3 billion years Reading Graphs: At what point in time do the two graph lines cross? - The Fossil Record Radioactive Decay
50% of each; the half-life of potassium-40 is 1.3 billion years, which means that half will break down into argon-40 every 1.3 billion years. Interpreting Data: At the point where the graph lines cross, how much of the sample consisted of potassium-40? How much consisted of argon-40? Explain why this is the case. - The Fossil Record Radioactive Decay
- The Fossil Record Earth’s History as a Clock • Fossils found in rock layers tell the history of life on Earth. The history of life can be compared to 12 hours on a clock.
Absolute Ages from Measuring Radioactive Decay • All radioactive elements break down over time • The time that it takes for HALF of the original material to turn into the final product is called the Half-Life • Using this we can look at the amounts of material left in a sample to get its actual age • Also known as Radiometric Dating.
Geologic Time Chart • Cenozoic Era- 65 MYBP to NOW Mammals dominate every niche Age of Mammals Whales, bats, primates, rodents, horses, elephants, rhinos appear • Mesozoic Era -250 to 65 MYBP • Early Mammals and Dinosaurs to Birds AGE of REPTILES • Paleozoic Era -550 to 250 MYBP Multi-cellular life takes off and in the end moves onto land • Archaean -4.5 BYBP to 550 MYBP • Single celled life emerges, photosynthesis invented • Jellyfish and Worms show up at the end.
Absolute Ages • How do we know the Earth is 4.5 billion years old? • We use radioactive half life's of different Isotopes. • Each element has a different Half-life and can be used to date materials of different ages
Radioactive Dating • Different elements decay at different rates C-14 has a half life of 5,730 years • U 235 has a half life of 704 million years • When we look at the oldest rocks on Earth and asteroids we get the same 4.5 billion year date for the solar systems formation.
Half Life's • ½ of a Carbon 14 sample will turn into Carbon 12 in 5,730 years • ½ of U (uranium) 238 to Pb (lead) 206 in 4.7 billion years • For each time scale we want to look at; there is a radioactive element with the right half-life to show the absolute age of a sample.
Index Fossils • Certain fossils are found only in particular rock layers or strata. • This helps us date rock layers and find • Mass Extinctions
What the Geologic/Fossil Record Shows • Life appears over 3.5 billion years ago and has been gaining in complexity ever since • Development of biomes happens in a logical sequence (The story of life makes since with land plants coming before land animals) • Most (99.99%) of all species that have ever lived are now extinct
Cosmic Calendar • Big Bang January 1 • Origin of Milky Way Galaxy May 1 • Origin of the solar system September 9 Formation of the Earth September 14 • Origin of life on Earth ~ September 25 • Formation of the oldest rocks known on Earth October 2 • Date of oldest fossils (bacteria and blue-green algae) October 9 • Invention of sex (by microorganisms) November 1 • Oldest fossil photosynthetic plants November 12 • Eukaryotes (first cells with nuclei) flourish November 15