Download
1 / 40
400 likes | 492 Vues
The NOAA/FAA/NCAR Winter Precipitation Test Bed: How Well Are We Measuring Snow?. Roy Rasmussen 1 , Bruce Baker 2 , John Kochendorfer 2 , Tilden Myers 2 , Scott Landolt 1 , Alex Fisher 3 , Jenny Black 1 , Julie Theriault 1 , Paul Kucera 1 , David Gochis 1 , Craig Smith 3 ,

E N D
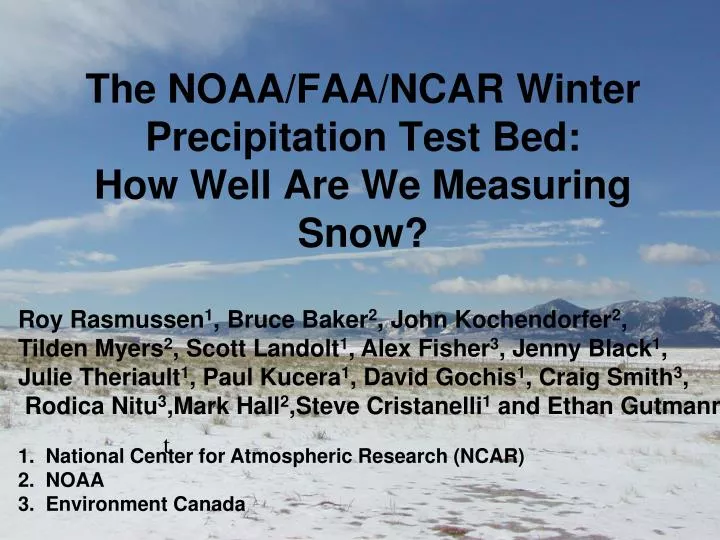
The NOAA/FAA/NCAR Winter Precipitation Test Bed:How Well Are We Measuring Snow? Roy Rasmussen1, Bruce Baker2, John Kochendorfer2, Tilden Myers2, Scott Landolt1, Alex Fisher3, Jenny Black1, Julie Theriault1, Paul Kucera1, David Gochis1, Craig Smith3, Rodica Nitu3,Mark Hall2,Steve Cristanelli1 and Ethan Gutmann1 1. National Center for Atmospheric Research (NCAR) 2. NOAA 3. Environment Canada t
Winter Weather Nowcasting for transportation requires real-time liquid equivalent measurements!
The NOAA/FAA/NCAR Winter Precipitation Test Bed was initially established in 1991 at NCAR in Boulder, Colorado to address FAA needs for real-time snowfall rates in support of ground deicing The NOAA Climate Reference Network program started using the site in the late 90’s to evaluate snow measuring instrumentation for climate purposes.
Challenges of automatic snow fall rate measurements: • Wind under-catch • - Gauge acting as obstacle to the flow, generating updrafts • Cap over of the orifice by snow accumulating on the gauge • Minimum detectable signal often large (to overcome noise) • Minimum detectable signal impacted by wind speed (higher the wind, the larger the minimum detectable signal) • Eliminating blowing snow false accumulations • High maintenance • Need to empty the bucket after snow fills up and refill bucket with glycol and oil.
Methods devised to solve the challenges: • Wind effect: • - Wind shields used to prevent updrafts from forming over weighing gauges. • Orifice blocking effect • - Heaters used to prevent snow build up on the body of the gauge. • Reduce minimum detectable signal by software and hardware: • Improved software to reduce false tips by vibration. • Improved hardware to eliminate vibrations and other noise. • 4. Reduce the minimum detectable signals increase with wind speed • Use wind shields that have high efficiency (e.g. WMO Double Fence Intercomparison Reference Shield)
Deployed multiple Double Fence Inter-comparison Reference (DFIR) shields as “truth” gauge Insert image of the Marshall site with DFIR
Layout of site: Flat and level site located 7 km south of Boulder, Colorado NCAR owned and operated with security fence
Documented snow under-catch behavior of various shields and gauges Hotplate DFIR Small DFIR Wind speed Double Alter Single Alter
Established transfer functions for various shields and gauges
Data used to develop transfer function shows significant scatter!
Thank You! Rasmussen et al. 2001
Mapped airflow around shields/gauges using sonic anemometers and numerical modeling
1.7 mm/hr Moderate LGT MOD HVY Established that visibility is a poor method to estimate the liquid equivalent rate of snow (light, moderate, heavy)
Developed and tested the Liquid Water Equivalent system for ground deicing use
Precipitation Type sensor (HSS) Precipitation Type sensor (Vaisala PWD-22) Moderate Snow Snow Liquid Water Equivalent System WXT temperature, humidity, and wind sensor (Vaisala) Hotplate (Yankee) Liquid Equivalent snowfall rate determination Weighing Snowgauge (GEONOR)
Developed method to heat the orifice of a gauge using temperature controlled heat tape (max temperature 2 ˚C)
Measured snow particle size distribution using video disdrometer
Disdrometer Observations 2DVD Specifications Measurement area = 10 cm x 10 cm Scan rate = 51.3 kHz Horizontal resolution = 0.15 mm Vertical resolution = 0.03 mm for snowflakes, 0.1 mm for raindrops Particle Characteristics Height and width Volume Terminal velocity Front view Side view ~4 mm [mm] [mm]
Rain Period: 1230 (17 March)-0200 UTC (18 March) Terminal Velocity vs Equ. Diameter 2100-2400 UTC 17 March Hydrometeor Size Distribution 2225-2300 UTC 17 March
Mixed Phase Period: 0200-0630 UTC Decreasing temperature Terminal Velocity vs Equ. Diameter 0200-0600 UTC Hydrometeor Size Distribution 0515-0520 UTC
Partially-Melted Snow Period : 2020 UTC- Temperature >0oC; Temporal maximum temperature Terminal Velocity vs Equ. Diameter 2200-2300 UTC Hydrometeor Size Distribution Crystal Types: Irregulars (hvy) 1-2 mm Spatial dendrites /snow grains (hvy) <1-2 mm Plates (lgt-mod) <1-2 mm Needles (mod) 2-4 mm Stellars (mod) <1-2 mm Aggregrate sizes 2-8 mm 2125-2130 UTC
Snow Period: -2020 UTCTemperature slightly above 0oC; Small crystals Terminal Velocity vs Equ. Diameter 1100-1200 UTC 1900-2000 UTC Hydrometeor Size Distribution Crystal Type: Irregulars (hvy) 1-2 mm Aggregrate sizes 3-4 mm 1950-1955 UTC
Measured vertical profile of precipitation using K-band radar
Summary • The NOAA/FAA/NCAR Winter Precipitation Test Bed has been used to investigate a number of important aspects of winter precipitation: • Under-catch of snow as a function of shield type and the development of transfer functions • Develop and test new wind shields • Evaluate the use of various gauge/shield combinations for both real-time and climate snow measurements. • Develop and test new precipitation instruments (hotplate) • Real-time measurement of snow for aircraft ground deicing purposes • The use of visibility to measure snow intensity • Snow size distributions and terminal velocity • Radar- reflectivity snowfall relationships
Summary • How well are we measuring snow? • While advances in shields and gauges have been made, we still don’t fully understand the significant scatter in the data nor have we designed the perfect wind shield to reduce the scatter. • Need to use direct measurements of the liquid equivalent rate of snow to estimate snow intensity in METARs rather than use visibility • The automated measurement of precipitation type and snow depth remains a significant challenge.