Download
1 / 51
550 likes | 1.27k Vues
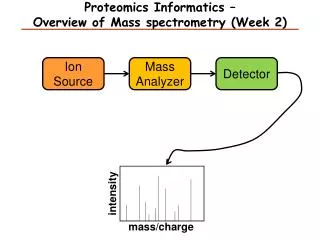
Proteomics and mass spectrometry. Manimalha Balasubramani. Outline. Mass spectrometers Protein identification Quantitative proteomics Protein-protein interactions. 1258.5603. 100. 1303.7007. 6.3E+4. 90. 80. 70. 60. 878.4913. % Intensity. 1031.5374. 983.4860. 50.

E N D
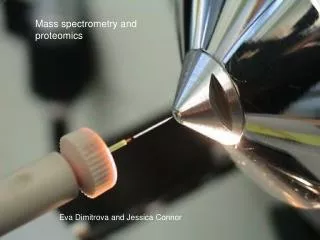
Proteomics and mass spectrometry Manimalha Balasubramani
Outline • Mass spectrometers • Protein identification • Quantitative proteomics • Protein-protein interactions
1258.5603 100 1303.7007 6.3E+4 90 80 70 60 878.4913 % Intensity 1031.5374 983.4860 50 1254.5614 1114.5428 1657.7953 40 842.4926 1586.8064 30 1232.5907 1964.8882 924.5113 1153.5334 20 1035.5696 965.4456 833.0566 1315.5780 1280.5370 1074.5405 2120.9883 1360.7209 1191.6130 1689.7865 2518.1062 1800.9324 1395.7062 1848.9419 1475.7374 870.5201 1630.7738 2211.0520 1593.7693 2169.9207 2393.0823 2439.0872 2021.9116 10 0 799.0 1179.2 1559.4 1939.6 2319.8 2700.0 Mass (m/z) A mass spectrum
Basically measures mass Adapted from google
Components… Adapted from an Analytical chemistry textbook
Ionization process Matrix Assisted Laser Desorption Ionization MALDI ElectroSpray Ionization ESI Nobel prize in Chemistry, 2002
Mass analyzers – several designs Adapted from Aebersold, R.; Mann, M. Nature 2003, 422, 198-207
GPCL inventory • ABI Voyager DE PRO, walk-up use • ABI 4700 Proteomics Analyzer • Thermoelectron LCQ Deca with Surveyor HPLC • ABI Qstar Elite with Ultimate 3000 HPLC • Bruker micrOTOF with Ultimate 3000 HPLC • Bruker 12 Tesla FTMS with Ultimate 3000 HPLC
Time-of-flight (TOF) analyzers MALDI TOF Voyager DE PRO ESI TOF Ultimate 3000 with micrOTOF
MALDI TOF - principle KE = zeV = 1mv2 2
MS of serum albumin ESI TOF MALDI TOF
Tandem mass spectrometer MALDI TOF/TOF MS and MS/MS
Ion Trap MS, MS2, MS3, ….MSn
Quadrupole-q-TOF ESI QqTOF
…installation phase…. FT MS
…bottom line… ..Resolution and mass accuracy…
FWHM Full width at half maxima of a peak
Resolution and mass accuracy Δm measured at 50% peak height is the Full Width at Half Maxima (FWHM) R = M Δm R = resolution M = mass of the peak of interest Δm = width in daltons of the peak
Mass accuracy is measured as parts per million value ppm = 106Δm= 106 M R
outline • Mass spectrometers • Protein identification • Quantitative proteomics • Protein-protein interactions
Peptide Mass Fingerprinting - PMF Database entry NCBI From: http://gobi.ym.edu.tw/course/mass/2004-0325.pdf
Informatics • Search engines • Mascot, Matrix Science • Sequest, Thermoelectron • Free-ware • Protein prospector (http://prospector.ucsf.edu/) • TPP tools (http://tools.proteomecenter.org/TPP.php)
Database searching using MASCOTOverview of the experiment Submission of data to MASCOT webserver
1D SDS PAGE of proteins Adapted from Aebersold, R.; Mann, M. Nature 2003, 422, 198-207
Mass spectrum Intensity Mass to charge ratio (m/z)
Peak list • Compiled from the mass spectra • Mass list • Mass list and intensity • Submitted to the search engine
A frequency factor matrix, F, is created, in which each row represents an interval of 100 Da in peptide mass, and each column an interval of 10 kDa in intact protein mass. As each sequence entry is processed, the appropriate matrix elements fi,j are incremented so as to accumulate statistics on the size distribution of peptide masses as a function of protein mass. The elements of F are then normalised by dividing the elements of each 10 kDa column by the largest value in that column to give the Mowse factor matrix M: After searching the experimental mass values against a calculated peptide mass database, the score for each entry is calculated according to: Where MProt is the molecular weight of the entry and the product term is calculated from the Mowse factor elements for each match between the experimental data and peptide masses calculated from the entry. Mascot scoring
List of common contaminants • Trypsin autolysis peptides • Matrix peaks • Keratin from skin, hair • Other contaminants
Protein Identification Adapted from Aebersold, R.; Mann, M. Nature 2003, 422, 198-207
Tandem mass spectrum http://qbab.aber.ac.uk
Tandem mass spectra (MS/MS) can be used for peptide sequencing • Database Searching • Peptide Mass Fingerprinting • Sequence tag approach • De novo sequencing • inspect raw data http://qbab.aber.ac.uk
Mascot Search Results Search title : SampleSetID: 362, AnalysisID: 567, MaldiWellID: 15790, SpectrumID: 17225, Path= \ Man i \ 102004 \ New Analysis 1 Database : NCBInr 20040606 (1846720 sequences; 611532004 residues) Timestamp : 20 Oct 2004 at 14:52:50 GMT Top Score : 681 for gi|180570 , creatine kinase [Homo sapiens] Probability Based Mowse Score Score is - 10*Log(P), where P is the probability that the observed match is a random event. Protein scores greater than 75 are significant (p<0.05).
Top hits from Mascot Search – there are multiple accession numbers for the same protein
Search returns a cluster of proteins with the same matching peptides
Creatine kinase B is the highest scoring protein Match to: gi|21536286 ; Score: 681 Creatine kinase - B [Homo sapiens] Nominal mass (Mr): 42591; Calculated pI value: 5.34 Observed Mass & pI: 43kd, 6.2-6.27 Sequence Coverage: 46%
outline • Mass spectrometers • Protein identification • Quantitative proteomics • Protein-protein interactions
Quantitative Proteomics Sample preparation
From 2D gels ….to MALDI or ESI MS Control Test Pool Cy3 Cy5 Image analysis with Delta2D, Decodon Quantitate Export spot list to robotic picker
..its high-throughput… 1st Dimension - Isoelectric focussing 2nd Dimension – SDS PAGE Spot picking Trypsin gel digest
Mass spectral analysis Isolate Nuclear Matrix MS In-gel Tryptic digest m/z MS/MS Database Search Tumor specific markers CC3, CC4, CC5, CC6a, CC6b Protein Identified m/z 2D Validation Immunoblotting 1D Yes No Immunohistochemistry de novo sequencing Colorectal cancer markers Balasubramani et al., Cancer Res., 2006
Shotgun proteomics Adapted from Aebersold, R.; Mann, M. Nature 2003, 422, 198-207
Group A, Indolent Group B, Aggressive Fractionate Eg. Immunodeplete, subcellular Fractionate Eg. Immunodeplete, subcellular Tryptic peptides Tryptic peptides Label with iTRAQ reagent 116 Label with iTRAQ reagent 115 Combine labeled digests LC fractionate MS and MS/MS Protein ID and Quantitate …typical workflow to identify biomarkers that distinguish indolent versus aggressive forms of cancer..
Sample handling In-solution Isoelectric focussing 1D or 2D LC MALDI HPLC
Protein-protein interaction studies • Immunoaffinity pull-downs • Tandem affinity purification
GPCL Billy W Day Paul Wood Mirunalni Thangavelu Tamanna Sultana Emanuel M Schreiber Chris Bolcato Chris Myers Patrick Miller Robert Wolfe
definitions • The amu is defined as 1/12th the mass of one neutral 6C12 atom • Amu is also called the dalton • 1 amu =1/12 ( 12g 12C/mol 12C 6.0221 x 10²³ atoms 12C/mol 12C 1.6605 x 10⁻²⁴ g/atom 12C