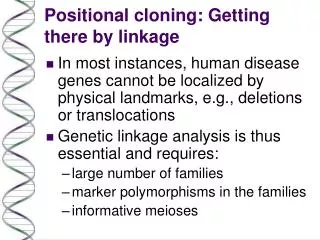
Linkage analysis: basic principles
Linkage analysis: basic principles. Manuel Ferreira & Pak Sham. Boulder Advanced Course 2005. Outline. 1. Aim. 2. The Human Genome. 3. Principles of Linkage Analysis. 4. Parametric Linkage Analysis. 5. Nonparametric Linkage Analysis. 1. Aim. For a heritable trait. Linkage:.

Linkage analysis: basic principles
E N D
Presentation Transcript
Linkage analysis: basic principles Manuel Ferreira & Pak Sham Boulder Advanced Course 2005
Outline 1. Aim 2. The Human Genome 3. Principles of Linkage Analysis 4. Parametric Linkage Analysis 5. Nonparametric Linkage Analysis
For a heritable trait... Linkage: localizes region of the genome where a locus (loci) that regulates the trait is likely to be harboured Family-specific phenomenon: Affected individuals in a family share the same ancestral predisposing DNA segment at a given trait locus Association: identifies a locus that regulates the trait Population-specific phenomenon: Affected individuals in a population share the same ancestral predisposing DNA segment at a given trait locus
DNA structure A DNA molecule is a linear backbone of alternating sugar residues and phosphate groups Attached to carbon atom 1’ of each sugar is a nitrogenous base: A, C, G or T Two DNA molecules are held together in anti-parallel fashion by hydrogen bonds between bases [Watson-Crick rules] Antiparallel double helix A gene is a segment of DNA which is transcribed to give a protein or RNA product Only one strand is read during gene transcription Nucleotide: 1 phosphate group + 1 sugar + 1 base
DNA polymorphisms RFLPs Minisatellites Microsatellites >100,000 Many alleles, (CA)n, very informative, even, easily automated A SNPs 10,054,521 (25 Jan ‘05) Most with 2 alleles (up to 4), not very informative, even, easily automated B
DNA organization 22 + 1 2 (22 + 1) 2 (22 + 1) 2 (22 + 1) ♂ ♁ ♂ A - A - A - ♁ B - ♂ ♁ ♁ ♂ Mitosis B - B - chr1 A - A - A - - A A - - A ♁ ♁ ♂ B - B - B - - B B - - B A - - A - A B - - B - B chr1 G1 phase S phase M phase Haploid gametes Diploid zygote 1 cell Diploid zygote >1 cell
DNA recombination 22 + 1 22 + 1 A - NR (♂) B - A - - A chr1 2 (22 + 1) 2 (22 + 1) B - - B - A ♁ Meiosis R chr1 (♂) (♁) ♂ ♁ - B A - A - - A - A chr1 B - B - - B - B A - R chr1 chr1 chr1 chr1 (♁) A - - A B - chr1 Diploid gamete precursor cell B - - B - A chr1 NR - B Haploid gamete precursors chr1 Hap. gametes
DNA recombination between linked loci 22 + 1 A - NR B - (♂) A - - A B - - B 2 (22 + 1) - A ♁ Meiosis NR - B (♂) (♁) ♂ ♁ A - A - - A - A B - B - - B - B A - NR B - (♁) A - - A B - - B Diploid gamete precursor - A - B NR Haploid gamete precursors Hap. gametes
Human Genome - summary DNA is a linear sequence of nucleotides partitioned into 23 chromosomes Two copies of each chromosome (2x22 autosomes + XY), from paternal and maternal origins. During meiosis in gamete precursors, recombination can occur between maternal and paternal homologs Recombination fraction between loci A and B (θ) Proportion of gametes produced that are recombinant for A and B If A and B are very far apart: 50%R:50%NR - θ = 0.5 If A and B are very close together: <50%R - 0 ≤ θ < 0.5 Recombination fraction (θ) can be converted to genetic distance (cM) Haldane: eg. θ=0.17, cM=20.8 Kosambi: eg. θ=0.17, cM=17.7
Linkage Analysis requires genetic markers Q M1 Mn M2 .3 .4 .4 .3 0.5 0.5 θ 0.5 .15 M1 Mn M2 .35 .22 .35 .26 0.5 θ 0.5 0.5 .4 .3 .3 .4 .1 M1 Mn M2
Linkage Analysis: Parametric vs. Nonparametric Gene Chromosome Recombination Genetic factors M Q A Mode of inheritance Correlation D Phe C E Environmental factors Adapted from Weiss & Terwilliger 2000
Linkage with informative phase known meiosis Gene Chromosome ♂ ♁ M1..6 Q1,2 Autosomal dominant, Q1 predisposing allele M2M5Q2Q2 M1M6Q1Q? M1 Q1 Informative Phase known M1Q1/M2Q2 M3M4Q2Q2 M1M2Q1Q2 M2 Q2 M1Q1/M3Q2 M2Q2/M3Q2 M1Q1/M4Q2 M1Q1/M4Q2 M2Q2/M4Q2 M2Q1/M3Q2 NR: M1Q1 NR: M2Q2 (~20.8 cM) θMQ = 1/6 = 0.17 R: M1Q2 R: M2Q1
Linkage with informative phase unknown meiosis Q2Q2 Q1Q? Informative Phase unknown M1M2Q1Q2 M3M4Q2Q2 M1Q1/M3Q2 M2Q2/M3Q2 M1Q1/M4Q2 M1Q1/M4Q2 M2Q2/M4Q2 M2Q1/M3Q2 M1Q2/M2Q1 M1Q1/M2Q2 P P N N 3 3 θ 1-θ R: M1Q1 NR: M1Q1 R: M2Q2 θ NR: M2Q2 1-θ 2 2 NR: M1Q2 R: M1Q2 1-θ θ 0 0 NR: M2Q1 R: M2Q1 1 1 1-θ θ + +
Parametric LOD score calculation Overall LOD score for a given θ is the sum of all family LOD scores at θ eg. LOD=3 for θ=0.28
Parametric Linkage Analysis - summary Q M1 Mn M2 .3 .4 .4 .3 θ 0.5 0.5 0.5 .1 For each marker, estimate the θ that yields highest LOD score across all families This θ (and the LOD) will depend upon the mode of inheritance assumed MOI determines the genotype at the trait locus Q and thus determines the number of meiosis which are recombinant or nonrecombinant. Limited to Mendelian diseases. Markers with a significant parametric LOD score (>3) are said to be linked to the trait locus with recombination fraction θ
Practical 1. Identify informative individual(s) Q1Q1 Q2Q? 2. Reconstruct possible phase(s) 3. Classify gametes as R or NR M1M2Q1Q1 M3M4Q1Q2 4. Count R and NR gametes 5. Express 6. Express LOD score M2M3Q1Q1 M1M4Q1Q2 M1M4Q1Q1 M2M4Q1Q2 M3Q2/M4Q1 M3Q1/M4Q2 P P N N 1 1 θ 1-θ R: M3Q1 NR: M3Q1 R: M4Q2 θ NR: M4Q2 1-θ 2 2 NR: M3Q2 R: M3Q2 1-θ θ 0 0 NR: M4Q1 R: M4Q1 1 1 1-θ θ + +
Practical II Talk example Practical example Graph each…
Outline 1. Aim 2. The Human Genome 3. Principles of Linkage Analysis 4. Parametric Linkage Analysis 5. Nonparametric Linkage Analysis
Approach Parametric: genotype marker locus & genotype trait locus (latter inferred from phenotype according to a specific disease model) Parameter of interest: θbetween marker and trait loci Nonparametric: genotype marker locus & phenotype If a trait locus truly regulates the expression of a phenotype, then two relatives with similar phenotypes should have similar genotypes at a marker in the vicinity of the trait locus, and vice-versa. Interest: correlation between phenotypic similarity and marker genotypic similarity No need to specify mode of inheritance, allele frequencies, etc...
Phenotypic similarity between relatives Squared trait differences Squared trait sums Trait cross-product Trait variance-covariance matrix Affection concordance T2 T1
Genotypic similarity between relatives IBSAlleles shared Identical By State “look the same”, may have the same DNA sequence but they are not necessarily derived from a known common ancestor M3 M1 M2 M3 Q3 Q1 Q2 Q4 IBDAlleles shared Identical By Descent are a copy of the same ancestor allele M1 M2 M3 M3 Q1 Q2 Q3 Q4 IBD IBS M1 M3 M1 M3 2 1 Q1 Q4 Q1 Q3 0 0 1 0 1 Inheritance vector (M)
Genotypic similarity between relatives - Inheritance vector (M) Number of alleles IBD Proportion of alleles IBD - M2 M3 M1 M3 0 0 0 1 1 0 Q2 Q4 Q1 Q3 M1 M3 M1 M3 0 0 1 0 0.5 1 Q1 Q4 Q1 Q3 M1 M3 M1 M3 0 0 0 0 2 1 Q1 Q3 Q1 Q3
Statistics that incorporate both phenotypic and genotypic similarities Phenotypic similarity 0.5 1 0 Genotypic similarity ( )
Haseman-Elston regression – Quantitative traits 0.5 1 0 Phenotypic dissimilarity = b × Genotypic similarity + c
VC ML – Quantitative & Categorical traits method 0.5 1 0 H1: H0: e.g. LOD=3
Genome-wide linkage analysis (e.g. VC) Individual LOD scores can be expressed as P values (Pointwise) LOD Chi-sq (n-df) P value 2.1 9.67 0.0009 (x4.6)
Statistics for selected samples Mean IBD sharing statistics (Risch & Zhang 1995, 1996) H0 (No linkage): Mean H1 (Linkage): Mean T2 H0 (No linkage): Mean H1 (Linkage): Mean T1
Other Linkage statistics Dependent variable: Phenotypes Independent variable: Extensions to Haseman Elston (Wright 1997, Drigalenko 1998, Elston et al. 2000, Forrest 2001, Visscher & Hopper 2001, Xu et al. 2000, Sham & Purcell 2001) VC ML with mixture distribution (Eaves et al. 1996) Dependent variable:Independent variable: Phenotypes Pedwide-regression Analysis (“reverse HE”) (Sham et al. 2002) Reverse VC ML (Sham et al. 2000) Statistics for affection traits Based on IBD scoring functions eg. Sall (Whittemore & Halpern 1994, Kong & Cox 1997) Forrest & Feingold 2000 Mixed statistic
Nonparametric Linkage Analysis - summary No need to specify mode of inheritance Models phenotypic and genotypic similarity of relatives Expression of phenotypic similarity, calculation of IBD HE and VC are the most popular statistics used for linkage of quantitative traits Other statistics available, specially for affection traits Type I error? Power?
Type I error True positive Theoretical(Lander & Kruglyak 1995) k LOD Empirical Type I error
Theoretical genome-wide thresholds Genome-wide threshold for significant linkage LOD score that occurs by chance alone on average once per 20 scans LOD = 3.6, Chi-sq = 16.7, Pointwise P = 0.000022 Genome-wide threshold for suggestive linkage LOD score that occurs by chance alone on average once per scan LOD = 2.2, Chi-sq = 10.1, Pointwise P = 0.00074
Empirical genome-wide thresholds Genome-wide threshold for significant linkage LOD score that occurs by chance alone on average once per 20 scans Genome-wide threshold for suggestive linkage LOD score that occurs by chance alone on average once per scan