Download
1 / 34
340 likes | 458 Vues
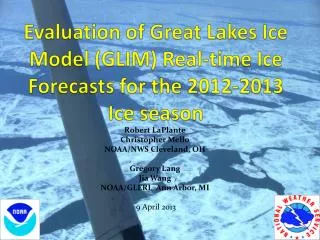
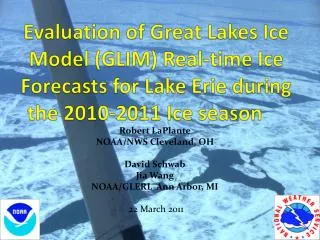
Evaluation of Great Lakes Ice Model (GLIM) Real-time Ice Forecasts for Lake Erie during the 2010-2011 Ice season. Robert LaPlante NOAA/NWS Cleveland, OH David Schwab Jia Wang NOAA/GLERL Ann Arbor, MI 22 March 2011. Outline. Description of the improved GLIM for the 2010-2011 ice season

E N D
Evaluation of Great Lakes Ice Model (GLIM) Real-time Ice Forecasts for Lake Erie during the 2010-2011 Ice season Robert LaPlante NOAA/NWS Cleveland, OH David Schwab Jia Wang NOAA/GLERL Ann Arbor, MI 22 March 2011
Outline • Description of the improved GLIM for the 2010-2011 ice season • Comparison of the GLIM to the National Ice Center analysis • Future plans for the GLIM MODIS 4-9 March 2010
Description of the GLIM • GLIM has been under development by GLERL since 2007 • GLIM is a combination of the Princeton Ocean Model for hydrodynamics and the Combined Ice Ocean Model tailored for the Great Lakes • GLIM which has two modules, runs twice a day for Lake Erie as part of the Great Lakes Coastal Forecast system (GLCFS) at NOAA/GLERL at 2 km resolution • Hourly Nowcast runs - ingest surface meteorological and daily NIC ice concentration observations • Forecast runs from 00 to 12o hours – driven by the NDFD • The GLIM is run using the latest surface forecast meteorological grids from the NWS National Digital Forecast Database (NDFD) out to 5 days
Description of the GLIM • GLIM Nowcasts of ice concentration are “nudged” towards the daily NIC ice concentration field • The initial conditions for the forecast module are based on nowcast runs • Model output for the GLIM is posted to the web • NWS CLE retrieves via ftp the GLIM for AWIPS and GFE
GLIM New Nudge Procedure • GLIM Nowcast nudging procedure added for 2010-2011 takes the GLIM ice concentration and “nudges” it close to the daily NIC ice concentration analysis • In grid cells where both NIC and GLIM are ice-free, no nudging is applied • In grid cells where the NIC has ice, but the GLIM is ice-free, the GLIM ice thickness is set to a small value (1 mm) and the ice concentration is “nudged” toward the NIC • In grid cells where the GLIM has a non-zero ice concentration, the GLIM concentration is nudged toward the NIC concentration, whether it is zero or non-zero
GLIM New Nudge Procedure • The nudging consists of changing the GLIM computed concentration by a fraction of the difference between the GLIM and NIC concentrations • The fraction is adjustable and is set to allow the GLIM to become nearly equal to the NIC field over a period of 12 hours
GLIM Ice Concentration is nudged toward the NIC ice concentration field which is updated daily
GLIM NOWCAST with NIC NUDGING Lake Erie Mean Ice Concentraton (%)
Integration of the GLIM and NDFD results in the Forecast Generation of: Surface Water Temperature Ice Concentration Ice Thickness Ice Drift http://www.glerl.noaa.gov/res/glcfs/erie-ice.php?lake=e&type=F&hr=01 For both the nowcast and forecast components of the GLIM
GLIM Ice Concentration in GFE(%)72 Hr Forecast from 4 Mar 2011
GLIM zoomed for Western Lake Erie Plenty of winter recreation near the islands of Lake Erie
Sources of Error in the Ice Concentration Forecast • Error in the daily NIC ice concentration analysis • NIC analysis data sources are lagged: ~00 and ~12 UTC RADARSAT passes & previous day ~18 UTC MODIS imagery and current day ~18 UTC MODIS imagery are combined and posted about 00 UTC the next day • Error in the NDFD parameters (wind, temperature, or dewpoint) • Error in the GLIM: nudging procedure, vertical mixing, no wave mixing
Day 1 ComparisonChange in GLIM MEAN Ice Concentration to NIC MEAN Ice Concentration Dec - Mar
Day 3 ComparisonChange in GLIM MEAN Ice Concentration to NIC MEAN Ice Concentration Dec - Mar
Day 5 ComparisonChange in GLIM MEAN Ice Concentration to NIC MEAN Ice Concentration Dec -
Bathymetry of Lake Erie (M) 64 22 10
Comparison of the GLIM to the NIC Analysis • BOIVerify is a statistical analysis application that is run at many NWS offices to help verify locally produced gridded forecasts from the NDFD • BOIVerify was modified at NWS CLE to ingest the GLERL GLIM forecasts of ice concentration and ice cover analysis from the National Ice Center (NIC) to help evaluate the GLIM
Ice Concentration Bias (%) 24 hourGLIM- NIC 6-21 Jan 2011 Too much ice forecast Too little ice forecast
Ice Concentration Bias (%) 48 hourGLIM- NIC 6-21 Jan 2011 Too much ice forecast Too little ice forecast
Ice Concentration Bias (%) 72 hourGLIM- NIC 6-21 Jan 2011 Too much ice forecast Too little ice forecast
Ice Concentration Bias (%) 96 hourGLIM- NIC 6-21 Jan 2011 Too much ice forecast Too little ice forecast
Ice Concentration Bias (%) 120 hourGLIM- NIC 6-21 Jan 2011 Too much ice forecast Too little ice forecast
Lake Erie Ice Drift 30 Jan- 15 Feb 2011 Persistent easterly drift of ice cover over the central basin of Lake Erie
Expected Value of the GLIM vs NIC24 hr Fcst 6-21 Jan 2011 Observed = NIC Forecast = GLIM Too little Ice Fcst
Expected Value of the GLIM vs NIC48 hr Fcst 6-21 Jan 2011 Observed = NIC Forecast = GLIM Too little Ice Fcst
Expected Value of the GLIM vs NIC72 hr Fcst 6-21 Jan 2011 Observed = NIC Forecast = GLIM Too little Ice Fcst
Expected Value of the GLIM vs NIC96 hr Fcst 6-21 Jan 2011 Observed = NIC Forecast = GLIM Too little Ice Fcst
Expected Value of the GLIM vs NIC120 hr Fcst 6-21 Jan 2011 Observed = NIC Forecast = GLIM Too little Ice Fcst
Summary of the GLERL GLIM2010-2011 ice season on Lake Erie • GLIM nowcasts for 2010-2011 were more realistic with daily nudging from the NIC ice concentration analysis • GLIM 1-5 Day forecasts were more realistic with being initialized with better nowcasts • During the rapid freeze up in January, the GLIM produced too little ice in the central basin and too much ice near Long Point • Trends in changes in observed spatial coverage were better simulated this season • Difficult to separate error in NDFD with error in GLIM
Future Plans for the GLIM • Upon evaluation the 2010-2011 ice season, the GLIM may be expanded to the other Great Lakes for the 2011-2012 ice season • Additional refinement of the GLIM is expected for the 2011-2012 ice season • Additional NDFD fields may be used by the GLIM – snowfall and QPF to make the model more realistic • Output from the GLIM may be added to the NDFD
Questions ? Robert.laplante@noaa.gov