Motion and Position in Physics
Explore the concepts of motion, position, and displacement in physics through motion diagrams, coordinate systems, vectors, time intervals, and position-time graphs. Learn how to represent and analyze objects' motion in different directions using mathematical and graphical tools.

Motion and Position in Physics
E N D
Presentation Transcript
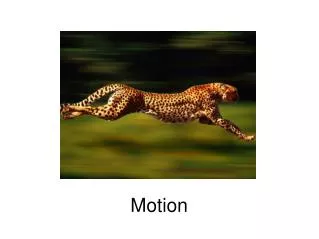
Motion Position, Time, Velocity
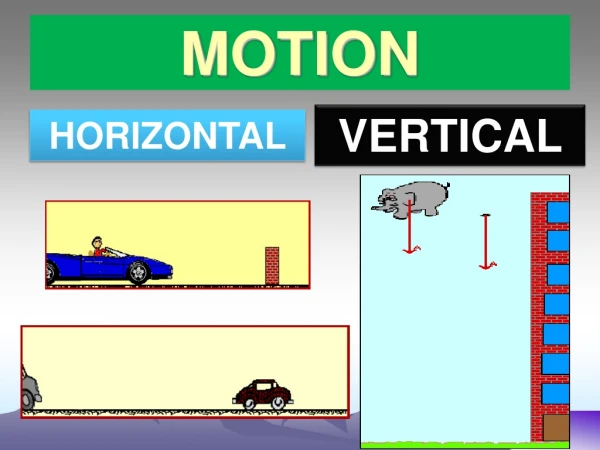
Motion • Motion • Movement is all around us • Travels in many directions • straight-line path of a bowling ball • curved path of a tether ball • spiral of a falling kite • swirls of water circling a drain • When objects are in motion, its position changes • Change in straight line, circle, arc, or back-and-forth vibration
Motion • Motion in a Straight Line • Movement in a straight line relates to place and time of an object • Where and when object positioned describes its motion • Example: car moved from point A to point B in a specific time period
Motion • Motion Diagrams vs. Particle Model • A motion diagram is a series of images showing position of object at equal time intervals • A particle model is a simplified version of a motion diagram that uses point to represent object
Motion • Motion Diagrams vs. Particle Model
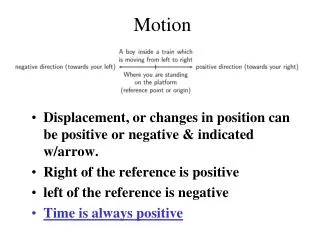
Motion • Coordinate Systems • A coordinate system tells you the location of the zero point of the variable you are studying and the direction in which the values of the variable increase • The origin is the point at which both variables have the value zero • In the example of the runner, the origin, represented by the zero end of the measuring tape, could be placed 5 m to the left of the tree
Motion • Coordinate Systems • The motion is in a straight line, thus, your measuring tape should lie along that straight line. The straight line is an axis of the coordinate system
Motion • Coordinate Systems • Coordinate systems can indicate distance an object is from origin at particular time by drawing arrow from origin to object • Two arrows locate runner’s position at two different times • Length equals distance
Motion • Coordinate Systems • A position 9 m to the left of the tree, 5 m left of the origin, would be a negative position, as shown in the figure below
Motion • Vectors and Scalars • Quantities that have both size (magnitude) and direction are called vectors • Quantities that are just numbers without any direction are called scalars • To add vectors graphically, length of vector should be proportional to magnitude of quantity being represented
Motion • Vectors and Scalars • The vector that represents the sum of the other two vectors is called the resultant • The resultant always points from the tail of the first vector to the tip of the last vector
Motion • Time Intervals and Displacement • Difference between initial and final times called time interval • Symbol for time interval is ∆t, where delta, ∆, used to represent change in quantity
Motion • Time Intervals and Displacement • Time interval can be defined mathematically as: • i and f represent initial and final times
Motion • Time Intervals and Displacement • Symbol d may be used to represent position • In physics, position is vector with tail at origin of a coordinate system and tip at place where object located at that time • Change in position during time interval between tiand tfis called displacement
Motion • Time Intervals and Displacement • Displacement mathematically defined as: • ∆d is equal to final position minus initial position
Motion • Time Intervals and Displacement • To subtract vectors, reverse the subtracted vector and then add the two vectors • This is because: A – B = A + (–B) • Figure a shows two vectors, A, 4 cm long pointing east, and B, 1 cm long also pointing east • Figure b shows –B, 1 cm long pointing west Resultant of A and –B is 3 cm long pointing east
Motion • Time Intervals and Displacement • To determine length and direction of displacement vector, ∆d = df− di, draw −di, which is direversed. Then draw dfand copy −diwith its tail at df’stip. Add dfand −di.
Motion • Time Intervals and Displacement • To completely describe an object’s displacement, must indicate distance traveled and direction moved. Displacement is a vector • While vectors drawn to represent position change, length and direction of displacement vector does not • Displacement vector always drawn with flat end, or tail, at earlier position, and point at later position
Motion • Position-Time Graphs
Motion • Position-Time Graphs • Graphs of an object’s position and time contain useful information about an object’s position at various times. It can be helpful in determining the displacement of an object during various time intervals
Motion • Position-Time Graphs • The data in the table can be presented by plotting the time data on a horizontal axis and the position data on a vertical axis, which is called a position-time graph
Motion • Position-Time Graphs • To draw the graph, plot the object’s recorded positions. Then, draw a line that best fits the recorded points. This line represents the most likely positions of the runner at the times between the recorded data points
Motion • Equivalent Representations • Words, pictorial representations, motion diagrams, data tables, and position-time graphs are all representations that are equivalent. They all contain the same information about an object’s motion
Motion • Motion of Multiple Objects • In the graph, when and where does runner B pass runner A?
Motion • Velocity • Suppose you recorded two joggers in one motion diagram, as shown in the figure below. From one frame to the next, you can see that the position of the jogger in red shorts changes more than that of the one wearing blue
Motion • Velocity • In other words, for a fixed time interval, the displacement, ∆d, is greater for the jogger in red because she is moving faster • She covers a larger distance than the jogger in blue does in the same amount of time
Motion • Velocity • Now, suppose that each jogger travels 100 m. The time interval, ∆t, would be smaller for the jogger in red than for the one in blue
Motion • Average Velocity • To compare the movement of both the runners you must first find the slope of each line
Motion • Average Velocity • The unit of the slope is meters per second. In other words, the slope tells how many meters the runner moved in 1 s. • The slope is the change in position, divided by the time interval during which that change took place, or (df - di) / (tf - ti), or Δd/Δt. • When Δd gets larger, the slope gets larger; when Δt gets larger, the slope gets smaller
Motion • Average Velocity • The slope of a position-time graph for an object is the object’s average velocity and is represented by the ratio of the change of position to the time interval during which the change occurred
Motion • Average Velocity • Average velocity is defined as the change in position, divided by the time during which the change occurred • The symbol ≡ means that the left-hand side of the equation is defined by the right-hand side
Motion • Average Velocity • It is a common misconception to say that the slope of a position-time graph gives the speed of the object • The slope of the position-time graph below is –5.0 m/s. It indicates the average velocity of the object and not its speed
Motion • Average Speed • The absolute value of the slope on a position-time graph tells you the average speed of the object, that is, how fast the object is moving • If an object moves in the negative direction, then its displacement is negative. The object’s velocity will always have the same sign as the object’s displacement
Motion • Average Speed • The graph describes the motion of a student riding his skateboard along a smooth, pedestrian-free sidewalk. What is his average velocity? What is his average speed?
Motion • Average Velocity • Unknown -
Motion • Instantaneous Velocity • A motion diagram shows the position of a moving object at the beginning and end of a time interval. During that time interval, the speed of the object could have remained the same, increased, or decreased. All that can be determined from the motion diagram is the average velocity • The speed and direction of an object at a particular instant is called the instantaneous velocity • The term velocity refers to instantaneous velocity and is represented by the symbol v
Motion • Average Velocity on Motion Diagrams • Although the average velocity is in the same direction as displacement, the two quantities are not measured in the same units • Nevertheless, they are proportional—when displacement is greater during a given time interval, so is the average velocity • A motion diagram is not a precise graph of average velocity, but you can indicate the direction and magnitude of the average velocity on it
Motion • Equation of Motion for Average Velocity • Any time you graph a straight line, you can find an equation to describe it • Based on the information shown in the table, the equation y = mx + b becomes d = vt + di, or, by inserting the values of the constants, d = (–5.0 m/s)t + 20.0 m
Motion • Equation of Motion for Average Velocity • An object’s position is equal to the average velocity multiplied by time plus the initial position Equation of Motion for Average Velocity
Motion • Equation of Motion for Average Velocity • A car starting from rest moves with an average speed of 6 m/s. Use the equation of motion for average velocity to calculate the distance the car traveled in 1 minute. • An motorcycle moving at a constant speed and the rider applies the brakes. What is the average velocity of the motorcycle 90 seconds after the brakes are applied given that the initial position was 52 meters and its position at 90 seconds is 25 meters? Average speed? • A boat moving on a stationary body of water has an average speed of 0.25 m/s. The boats initial position was 42 meters from shore. After 3 minutes, how far from shore has the boat travelled?