Expression Profiles of NFkB Pathway Molecules in Pancreatic Cells Under Different Treatments
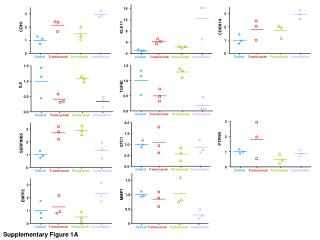
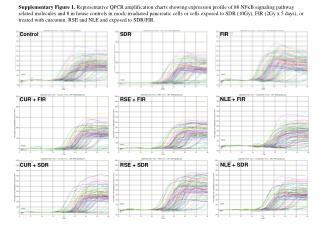
This study presents QPCR amplification charts showcasing the expression profiles of 88 NFkB signaling pathway-related molecules alongside 8 in-house controls. The analysis includes mock-irradiated pancreatic cells, cells exposed to simulated dose rates (SDR) of 10Gy, and fractionated irradiation (FIR) at 2Gy over 5 days. Additionally, the effects of curcumin, RSE, and NLE in conjunction with SDR/FIR treatments are evaluated. These findings enhance our understanding of the NFkB pathway's role in response to radiation and therapeutic compounds.

Expression Profiles of NFkB Pathway Molecules in Pancreatic Cells Under Different Treatments
E N D
Presentation Transcript
Supplementary Figure 1. Representative QPCR amplification charts showing expression profile of 88 NFkB signaling pathway related molecules and 8 in house controls in mock-irradiated pancreatic cells or cells exposed to SDR (10Gy), FIR (2Gy x 5 days), or treated with curcumin, RSE and NLE and exposed to SDR/FIR. FIR Control SDR NLE + FIR CUR + FIR RSE + FIR NLE + SDR CUR + SDR RSE + SDR