Download
1 / 48
490 likes | 670 Vues
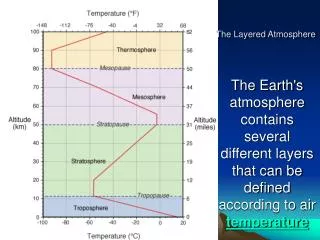
The “normal” state of layered dichalcogenides. Arghya Taraphder. Department of Physics and Centre for Theoretical Studies. Indian Institute of Technology Kharagpur. Workshop @ Harish Chandra Research Institute, November 12-14, 2010. Salient Features.

E N D
The “normal” state of layered dichalcogenides Arghya Taraphder Department of Physics and Centre for Theoretical Studies Indian Institute of Technology Kharagpur Workshop @ Harish Chandra Research Institute, November 12-14, 2010
Salient Features • Transition metal dichalcogenide – TM atoms separated by two layers of chalcogen atoms TM atoms form 2D triangular lattice • CDW & Superconductivity (likely to be anisotropic) • Partially filled TM d band or chalcogen p band:[]d1/0 • 1T and 2H type lattice structure • Both I and C CDW at moderate temperature • Normal to SC transition with pressure/doping • Normal transport unusual (cf. HTSC)
Typical Phase diagram 2H-TaSe2 D.B. Mcwhan, et al. PRL 45,269(1980)(2H-TaSe2) 1T-TiSe2 A. F. Kusmartseva, et al. PRL 103, 236401(2009) (1T-TiSe2) B. Sipos, et al. Nat. mater. 7, 960 (2008) (IT-TaS2) 1T-TaS2
Cava et al. 2H-TaS2
Quantum critical? Castro-Neto, loc cit Cava, PRL (2008)
DC Resistivities Aebi, loc cit
Resistivity of TMDs: 1T and 2H P. Aebi, et al. Journal of Electron Spectroscopy and Related Phenomena 117–118 (2001) Y. Ueda, et al.Journal of Physical Society of Japan 56 2471-2476, (1987).
2H-TaSe2 Vescoli et al, PRL 81, 453 (1998)
Optical conductivity (0.04 < E < 5 eV range) R C Dynes, et al., EPJB 33, 15 (2003)
Features of dc transport and Re σ (ω) • “Drude-like” peak at ω=0 for both systems along both ab and • C-directions, narrowing at low T, indicating freezing of • scattering of charge carriers at low energy • Tccdw does not affect transport at all, in fact thermodynamics • is also unaffected • Broad conductivity upto large energies (~0.5 eV)
Spectral weight distribution • Spectral weight is non-zero even upto 5 eV and • beyond – “recovery” of total n uncertain • Shifts progressively towards FIR as T is lowered - • condensation at lower frequency • Nothing abrupt happens as T_CDW is crossed
Transport scattering rate ab-plane
Transport scattering rate c-axis
Scattering rate from transport • Strongly frequency dependent. Rapid suppression • of both Γab and Γc below characteristic freq. ~ 500 /cm • Possible “pseudogap” in 20K curve • High and low T Γab cross each other for TaSe2 • at some frequency • No saturation of Γab upto 0.6 eV • Both Γab and Γc are above Γ= ω line upto 2000 /cm and • nearly linear in ω
“QP” Scattering Rate & SE from ARPES Valla, PRL 85, 4759 (2000)
Fit with momentum-indep. SE Valla, loc. cit..
Electronic structure Aebi, JES 117, 433 (2001)
Self-energy from ARPES • Local - no k-dependence • Re Σ peaks at 65 meV, Im Σ drops there – • characteristic of a photo-hole scattering off a • collective ‘mode’ ~ 65 mev (too large for all phonons • in TaSe2) • Im Σ(0) matches excellently with transport Γ(0) in • its T-dependence
Band structure 2H-TaSe2 H.E. Brauer,et al. J. Phys. Cond. Matter 13, 9879 (2001) Aebi, JES 117, 433 (2001)
Tight Binding Description N V Smith, et al. J. Phys. C:Solid State Phys. 18 (1985) 3175-3189
Tight binding fit near FL for 2H-TaSe2 N V Smith, et al. J. Phys. C: Solid State Phys. 18 (1985) 3175-3189.
Fermi surface map for the TB bands 2H-TaSe2 1T-TaS2
ARPES - 2H-TaSe2 Liu, PRL 80, 5762 (1998)
)Pseudogap in 2H-TaSe2, Borisenko et al, PRL 100, 196402 (2008)
Fermi surface and ARPES - 2H type S V Borisenko, et al. Phys. Rev. Lett. 100, 196402 (2008) N V Smith, et al. J. Phys. C: Solid State Phys. 18 (1985) 3175-3189.
Fermi surface and ARPES - 1T type N V Smith, et al. J. Phys. C: Solid State Phys. 18 (1985) 3175-3189. F.Clerc, et al. Physica B 351 245-249, (2004)
Fermi surface of 1T-TiSe2 P. Aebi, et al. Phys.Rev.B 61 16213, (2000)
Superlattice & BZ in the CDW phase of Dichalcogenides 2H-TaSe2 1T-TaS2 N V Smith, et al. J. Phys. C:Solid State Phys. 18 (1985) 3175-3189.
Our Work: LDA - tight binding fit near FL for 2H-TaSe2 N V Smith, et al. J. Phys. C: Solid State Phys. 18 (1985) 3175-3189.
Fermi surface map for the TB bands 2H-TaSe2 1T-TaS2
Spectral Function for 2H-TaSe2 After DMFT Before DMFT
Temperature dependent Spectral function at different pressure
Conclusion • DMFT Spectral function is broadened. • With application of Inter-orbital coulomb interaction the system goes to insulator. • With application of Inter-orbital hopping DMFT orbital occupation changes from LDA. • There is a opening of gap with increasing temperature up-to 140K. • With decreasing pressure hole pockets in the Fermi surface disappear. • With increasing pressure the gap formed at the Fermi surface decreases.