Download
1 / 15
150 likes | 226 Vues
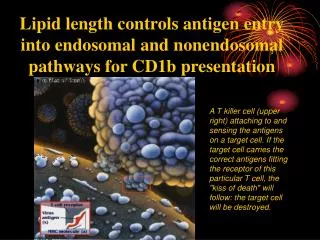
Learn how lipid length influences antigen presentation by CD1 proteins. Explore the endosomal and nonendosomal pathways in CD1B-mediated T-cell activation. Discover the structure of human CD1B and its role in immune responses.

E N D
Lipid length controls antigen entry into endosomal and nonendosomal pathways for CD1b presentation
CD1 Proteins • CD1 is a conserved family of non-(MHC) encoded MHC like Glycoproteins that specialize in presenting lipids • Four human CD1 proteins — CD1A, CD1B, CD1C and CD1D — present lipid antigens by insertion of lipids into a groove in the proteins to form CD1–lipid complexes. • These complexes activate T cells after direct recognition by specific T-cell receptors.
Where are CD1 proteins found? • Cortical Thymocytes • carry out positive selection of CD1 restricted T cells. • Antigen Presenting Cells • Myeloid dendritic cells • Macrophages • B cells
Figure 1.CD1b-mediated T cell activation by GMM antigens of varying alkyl chain length. (a) The positive mode electrospray ionization mass spectra (ESI-MS) of glucose monomycolate isolated from M. phlei, N. farcinica and R. equi showed ions corresponding to an alkane series of sodium adducts of GMM with the indicated lipid length Cx. (b) Synthetic condensation of free fatty acids of varying length yielded mycolic acids (Cx) with an -branch (C[x/2]-2) and a meromycolate (mero) chain (C[x/2]+2) that were glucosylated as described20, 28. Positive mode ESI-MS of synthetic GMM with a C32 mycolic acid is shown, and the lengths of the - and meromycolate chains of the other analogs are summarized. (c,d) The proliferative responses of the CD1b-restricted T cell line LDN5 to GMMs of the indicated lipid lengths were measured by [3H]thymidine incorporation. Data are mean s.d. of triplicate samples.
Figure 2.DCs internalized GMM antigens and selectively delivered C80 GMM to late endosomal and lysosomal compartments. (a) Biosynthetically labeled [14C] C32 GMM was cultured with DCs in the presence or absence of metabolic inhibitors (0.02% NaN3 and 50 mM 2-DOG). Cells were extensively washed with media, then dissolved in scintillant to measure cell-associated GMM. (b) Metabolism-dependent association (cellular uptake) of C32 and C80 GMM with DCs was measured at 0.5 g/ml. (c) DCs (105) were cultured with [14C]C80 or [14C]C32 GMM (7.5 g/ml) for 24 h and washed. The GMM-pulsed DCs were disrupted by shearing, centrifuged to remove nuclei and fractionated by density centrifugation on Percoll gradients as described30. Gradient fractions (1–10) were assayed for -hexosaminidase activity by ELISA and for distribution of CD1b and markers of early endosomes and plasma membrane (Rab5, transferrin receptor and MHC class I) by immunoblotting30. (d) (Upper panel) C32 and C80 GMM content in gradient fractions was detected by scintillation counting, which shows selective accumulation of C80 GMM in dense fractions (1–3). One representative of four experiments is shown. (Lower panel) The calculated ratios of C80versus C32 GMM in each fraction compared to the distribution of -hexosaminidase for the pooled data from all four experiments.
Figure 3.B lymphoblastoid cells and DCs differed in the efficiency of uptake and presentation of GMM alkyl chain length analogs. (a) Irradiated CD1b-transfected C1R cells or DCs (105 cells/well) were cultured with GMMs of the indicated chain lengths, PMA (10 ng/ml) and J.RT3/LDN5 cells. After 24 h, supernatants were tested for IL-2 production by measuring [3H]thymidine incorporation into IL-2–dependent HT-2 cells. (b) Uptake of C32 GMM (0.2 g/ml) by DCs and C1R cells was measured as in Fig. 2. (c) Irradiated DCs were fixed with 0.02% glutaraldehyde before or after 4 h of culture with GMM as described21. The proliferative response of LDN5 T cells after 4 days of culture with antigen-pulsed DCs was measured by [3H]thymidine incorporation. (Ag, antigen.)
Figure 4.Presentation of GMMs with short alkyl chains was more rapid, but less stable, than presentation of GMMs with longer alkyl chains. (a) Resting LDN5 T cells were loaded with Fura red and Fluo-4 dyes and subjected to flow cytometric analysis. Release of intracellular calcium after treatment with 1 g/ml of ionomycin (MFI=317 in FL1) or coincubation with C1R cells loaded with 20 M C80 GMM (MFI=239 in FL1) for 4 h were measured by the increase in fluorescence intensity at low wavelengths (FL1) and inhibition of fluorescence intensity at higher wavelengths (FL3). Data are expressed as the percentage of dye-treated cells within the high FL1, low FL3 gate. (b) Comparison of LDN5 activation by ionomycin (iono), C1R.CD1b cells (CD1b) or C1R.mock cells (mock) that were treated with 20 M C32 GMM (C32) or C80 GMM (C80) for 20 h. Data were collected for 20 s or 5000 events after centrifugation (spin), or not, of cells for 60 s. (c) C1R.CD1b cells were preincubated with 20 M C80 GMM or C32 GMM for the indicated times, added at a 1:1 ratio LDN5 cells, centrifuged for 60 s and immediately assayed for calcium flux. (d) C1R.CD1b cells were pulsed with C32 GMM or C80 GMM at the indicated concentrations for either 20 h or 30 min. After the antigen pulse (P, prewash), cells were extensively washed, chased in antigen-free medium for the indicated times, then tested for antigen presentation by exposing them to LDN5 T cells and immediately assaying these for calcium flux.
Figure 5.Presentation of GMM chain length analogs by cells expressing CD1b proteins that lack endosomal targeting sequences. (a–c) IL-2 release by J.RT-3/LDN5 cells was measured in response to GMM of the indicated alkyl chain lengths presented by C1R cells expressing wild-type CD1b (WT), CD1b.TD (TD), CD1b.Y311A (Y311A) or CD1b.DAF (DAF)22, 35. The cell surface expression of CD1b by clones was evaluated by flow cytometric analysis with the murine mAb 4A7; MFIs are given in parentheses. C1R clones expressing CD1b, CD1b.TD and CD1b.Y311A cells that expressed equivalent MFIs were chosen for analysis. (d) IL-2 release by J.RT-3 cells was measured in response to C32 GMM treated C1R clones that expressed low medium or high amounts of CD1b or CD1b.TD. C1R.mock cells were used as a control.
Figure 6.Transformed thymocytes more efficiently presented C32 GMM. IL-2 release by JRT-3/LDN5 cells in response to C32 GMM (open) and C80 GMM (filled) presented by DCs or HPB-ALL cells was measured as in Fig. 3.