THE HEART
510 likes | 530 Vues
Learn about the sequence of excitation in the heart, including the role of the sinoatrial node, atrioventricular node, bundle of His, bundle branches, and Purkinje fibers. Understand the role of the intrinsic conduction system and how defects can lead to arrhythmias and other heart rhythm disorders. Explore the extrinsic innervation of the heart and the role of the autonomic nervous system. Discover how electrocardiography can be used to analyze the electrical activity of the heart.

THE HEART
E N D
Presentation Transcript
CHAPTER # 18 (B) THE HEART
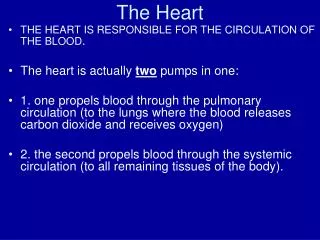
Heart Physiology: Sequence of Excitation • Sinoatrial (SA) node (pacemaker) • Generates impulses about 75 times/minute (sinus rhythm) • Depolarizes faster than any other part of the myocardium
Heart Physiology: Sequence of Excitation • Atrioventricular (AV) node • Smaller diameter fibers; fewer gap junctions • Delays impulses approximately 0.1 second • Depolarizes 50 times per minute in absence of SA node input
Heart Physiology: Sequence of Excitation • Atrioventricular (AV) bundle (bundle of His) • Only electrical connection between the atria and ventricles
Heart Physiology: Sequence of Excitation • Right and left bundle branches • Two pathways in the interventricular septum that carry the impulses toward the apex of the heart
Heart Physiology: Sequence of Excitation • Purkinje fibers • Complete the pathway into the apex and ventricular walls • AV bundle and Purkinje fibers depolarize only 30 times per minute in absence of AV node input
Superior vena cava Right atrium Thesinoatrial (SA) node(pacemaker) generates impulses. 1 Internodal pathway Left atrium 2 The impulses pause (0.1 s) at the atrioventricular (AV) node. Purkinje fibers Theatrioventricular (AV) bundle connects the atria to the ventricles. 3 Thebundle branches conduct the impulses through the interventricular septum. 4 Inter- ventricular septum ThePurkinje fibers depolarize the contractile cells of both ventricles. 5 (a) Anatomy of the intrinsic conduction system showing the sequence of electrical excitation Figure 18.14a
Homeostatic Imbalances • Defects in the intrinsic conduction system may result in • Arrhythmias: irregular heart rhythms • Uncoordinated atrial and ventricular contractions • Fibrillation: rapid, irregular contractions; useless for pumping blood
Homeostatic Imbalances • Defective SA node may result in • Ectopic focus: abnormal pacemaker takes over • If AV node takes over, there will be a junctional rhythm (40–60 bpm) • Defective AV node may result in • Partial or total heart block • Few or no impulses from SA node reach the ventricles
Extrinsic Innervation of the Heart • Heartbeat is modified by the ANS • Cardiac centers are located in the medulla oblongata • Cardioacceleratory center innervates SA and AV nodes, heart muscle, and coronary arteries through sympathetic neurons • Cardioinhibitory center inhibits SA and AV nodes through parasympathetic fibers in the vagus nerves
Dorsal motor nucleus of vagus The vagus nerve (parasympathetic) decreases heart rate. Cardioinhibitory center Medulla oblongata Cardio- acceleratory center Sympathetic trunk ganglion Thoracic spinal cord Sympathetic trunk Sympathetic cardiac nervesincrease heart rate and force of contraction. AV node SA node Parasympathetic fibers Sympathetic fibers Interneurons Figure 18.15
Electrocardiography • Electrocardiogram (ECG or EKG): a composite of all the action potentials generated by nodal and contractile cells at a given time • Three waves • P wave: depolarization of SA node • QRS complex: ventricular depolarization • T wave: ventricular repolarization
QRS complex Sinoatrial node Ventricular depolarization Ventricular repolarization Atrial depolarization Atrioventricular node S-T Segment P-Q Interval Q-T Interval Figure 18.16
Depolarization Repolarization SA node R R T P T P Q S 1 Atrial depolarization, initiatedby the SA node, causes theP wave. Q S 4 Ventricular depolarizationis complete. R AV node R T P T P Q S Q 2 With atrial depolarizationcomplete, the impulse isdelayed at the AV node. S 5 Ventricular repolarizationbegins at apex, causing theT wave. R R T P T P Q S Q S 3 Ventricular depolarizationbegins at apex, causing theQRS complex. Atrialrepolarization occurs. 6 Ventricular repolarizationis complete. Figure 18.17
R Depolarization SA node Repolarization T P Q S 1 Atrial depolarization, initiated bythe SA node, causes the P wave. Figure 18.17, step 1
R Depolarization SA node Repolarization T P Q S 1 Atrial depolarization, initiated bythe SA node, causes the P wave. R AV node T P Q S 2 With atrial depolarization complete,the impulse is delayed at the AV node. Figure 18.17, step 2
R Depolarization SA node Repolarization T P Q S 1 Atrial depolarization, initiated bythe SA node, causes the P wave. R AV node T P Q S 2 With atrial depolarization complete,the impulse is delayed at the AV node. R T P Q S 3 Ventricular depolarization beginsat apex, causing the QRS complex.Atrial repolarization occurs. Figure 18.17, step 3
Depolarization Repolarization R T P Q S 4 Ventricular depolarization iscomplete. Figure 18.17, step 4
Depolarization Repolarization R T P Q S 4 Ventricular depolarization iscomplete. R T P Q S 5 Ventricular repolarization beginsat apex, causing the T wave. Figure 18.17, step 5
Depolarization Repolarization R T P Q S 4 Ventricular depolarization iscomplete. R T P Q S 5 Ventricular repolarization beginsat apex, causing the T wave. R T P Q S 6 Ventricular repolarization iscomplete. Figure 18.17, step 6
Depolarization Repolarization SA node R R T P T P Q S 1 Atrial depolarization, initiatedby the SA node, causes theP wave. Q S 4 Ventricular depolarizationis complete. R AV node R T P T P Q S Q 2 With atrial depolarizationcomplete, the impulse isdelayed at the AV node. S 5 Ventricular repolarizationbegins at apex, causing theT wave. R R T P T P Q S Q S 3 Ventricular depolarizationbegins at apex, causing theQRS complex. Atrialrepolarization occurs. 6 Ventricular repolarizationis complete. Figure 18.17
(a) Normal sinus rhythm. (b) Junctional rhythm. The SA node is nonfunctional, P waves are absent, and heart is paced by the AV node at 40 - 60 beats/min. (d) Ventricular fibrillation. These chaotic, grossly irregular ECG deflections are seen in acute heart attack and electrical shock. (c) Second-degree heart block. Some P waves are not conducted through the AV node; hence more P than QRS waves are seen. In this tracing, the ratio of P waves to QRS waves is mostly 2:1. Figure 18.18
Heart Sounds • Two sounds (lub-dup) associated with closing of heart valves • First sound occurs as AV valves close and signifies beginning of systole • Second sound occurs when SL valves close at the beginning of ventricular diastole • Heart murmurs: abnormal heart sounds most often indicative of valve problems
Aortic valvesounds heard in 2nd intercostal space at right sternal margin Pulmonary valve sounds heard in 2nd intercostal space at left sternal margin Mitral valvesounds heard over heart apex (in 5th intercostal space) in line with middle of clavicle Tricuspid valvesounds typically heard in right sternal margin of 5th intercostal space Figure 18.19
Mechanical Events: The Cardiac Cycle • Cardiac cycle: all events associated with blood flow through the heart during one complete heartbeat • Systole—contraction • Diastole—relaxation
Phases of the Cardiac Cycle • Ventricular filling—takes place in mid-to-late diastole • AV valves are open • 80% of blood passively flows into ventricles • Atrial systole occurs, delivering the remaining 20% • End diastolic volume (EDV): volume of blood in each ventricle at the end of ventricular diastole
Phases of the Cardiac Cycle • Ventricular systole • Atria relax and ventricles begin to contract • Rising ventricular pressure results in closing of AV valves • Isovolumetric contraction phase (all valves are closed) • In ejection phase, ventricular pressure exceeds pressure in the large arteries, forcing the SL valves open • End systolic volume (ESV): volume of blood remaining in each ventricle
Phases of the Cardiac Cycle • Isovolumetric relaxation occurs in early diastole • Ventricles relax • Backflow of blood in aorta and pulmonary trunk closes SL valves and causes dicrotic notch (brief rise in aortic pressure)
Left heart QRS P T P Electrocardiogram 1st 2nd Heart sounds Dicrotic notch Aorta Pressure (mm Hg) Left ventricle Atrial systole Left atrium EDV Ventricular volume (ml) SV ESV Atrioventricular valves Open Closed Open Aortic and pulmonary valves Closed Open Closed Phase 1 2a 2b 3 1 Left atrium Right atrium Left ventricle Right ventricle Ventricular filling Atrial contraction Ventricular ejection phase Isovolumetric relaxation Ventricular filling Isovolumetric contraction phase 1 2a 2b 3 Ventricular filling (mid-to-late diastole) Ventricular systole (atria in diastole) Early diastole Figure 18.20
Cardiac Output (CO) • Volume of blood pumped by each ventricle in one minute • CO = heart rate (HR) x stroke volume (SV) • HR = number of beats per minute • SV = volume of blood pumped out by a ventricle with each beat
Cardiac Output (CO) • At rest • CO (ml/min) = HR (75 beats/min) SV (70 ml/beat) = 5.25 L/min • Maximal CO is 4–5 times resting CO in nonathletic people • Maximal CO may reach 35 L/min in trained athletes • Cardiac reserve: difference between resting and maximal CO
Regulation of Stroke Volume • SV = EDV – ESV • Three main factors affect SV • Preload • Contractility • Afterload
Regulation of Stroke Volume • Preload: degree of stretch of cardiac muscle cells before they contract (Frank-Starling law of the heart) • Cardiac muscle exhibits a length-tension relationship • At rest, cardiac muscle cells are shorter than optimal length • Slow heartbeat and exercise increase venous return • Increased venous return distends (stretches) the ventricles and increases contraction force
Regulation of Stroke Volume • Contractility: contractile strength at a given muscle length, independent of muscle stretch and EDV • Positive inotropic agents increase contractility • Increased Ca2+ influx due to sympathetic stimulation • Hormones (thyroxine, glucagon, and epinephrine) • Negative inotropic agents decrease contractility • Acidosis • Increased extracellular K+ • Calcium channel blockers
Extracellular fluid Norepinephrine Adenylate cyclase Ca2+ b1-Adrenergic receptor Ca2+ channel G protein (Gs) ATP is converted to cAMP Cytoplasm a Phosphorylates plasma membrane Ca2+ channels, increasing extra- cellular Ca2+ entry GDP Inactive protein kinase A Active protein kinase A Phosphorylates SR Ca2+channels, increasing intracellular Ca2+ release Phosphorylates SR Ca2+ pumps, speeding Ca2+ removal and relaxation c b Ca2+ Enhanced actin-myosin interaction binds to Ca2+ Troponin Ca2+uptake pump SR Ca2+ channel Cardiac muscle force and velocity Sarcoplasmic reticulum (SR) Figure 18.21
Regulation of Stroke Volume • Afterload: pressure that must be overcome for ventricles to eject blood • Hypertension increases afterload, resulting in increased ESV and reduced SV
Regulation of Heart Rate • Positive chronotropic factors increase heart rate • Negative chronotropic factors decrease heart rate
Autonomic Nervous System Regulation • Sympathetic nervous system is activated by emotional or physical stressors • Norepinephrine causes the pacemaker to fire more rapidly (and at the same time increases contractility)
Autonomic Nervous System Regulation • Parasympathetic nervous system opposes sympathetic effects • Acetylcholine hyperpolarizes pacemaker cells by opening K+ channels • The heart at rest exhibits vagal tone (parasympathetic)
Autonomic Nervous System Regulation • Atrial (Bainbridge) reflex: a sympathetic reflex initiated by increased venous return • Stretch of the atrial walls stimulates the SA node • Also stimulates atrial stretch receptors activating sympathetic reflexes
Exercise (by skeletal muscle and respiratory pumps; see Chapter 19) Bloodborne epinephrine, thyroxine, excess Ca2+ Exercise, fright, anxiety Heart rate (allows more time for ventricular filling) Venous return Sympathetic activity Parasympathetic activity Contractility EDV (preload) ESV Heart rate Stroke volume Cardiac output Initial stimulus Physiological response Result Figure 18.22
Chemical Regulation of Heart Rate • Hormones • Epinephrine from adrenal medulla enhances heart rate and contractility • Thyroxine increases heart rate and enhances the effects of norepinephrine and epinephrine • Intra- and extracellular ion concentrations (e.g., Ca2+ and K+) must be maintained for normal heart function
Other Factors that Influence Heart Rate • Age • Gender • Exercise • Body temperature
Homeostatic Imbalances • Tachycardia: abnormally fast heart rate (>100 bpm) • If persistent, may lead to fibrillation • Bradycardia: heart rate slower than 60 bpm • May result in grossly inadequate blood circulation • May be desirable result of endurance training
Congestive Heart Failure (CHF) • Progressive condition where the CO is so low that blood circulation is inadequate to meet tissue needs • Caused by • Coronary atherosclerosis • Persistent high blood pressure • Multiple myocardial infarcts • Dilated cardiomyopathy (DCM)
Developmental Aspects of the Heart • Embryonic heart chambers • Sinus venous • Atrium • Ventricle • Bulbus cordis
Ductus arteriosus Aorta Arterial end Arterial end Superior vena cava 4a Pulmonary trunk 4 Tubular heart Ventricle Foramen ovale 3 Atrium 2 Ventricle 1 Ventricle Inferior vena cava Venous end Venous end (a) Day 20: Endothelial tubes begin to fuse. (b) Day 22: Heart starts pumping. (c) Day 24: Heart continues to elongate and starts to bend. (d) Day 28: Bending continues as ventricle moves caudally and atrium moves cranially. (e) Day 35: Bending is complete. Figure 18.23
Developmental Aspects of the Heart • Fetal heart structures that bypass pulmonary circulation • Foramen ovale connects the two atria • Ductus arteriosus connects the pulmonary trunk and the aorta
Developmental Aspects of the Heart • Congenital heart defects • Lead to mixing of systemic and pulmonary blood • Involve narrowed valves or vessels that increase the workload on the heart
Narrowed aorta Occurs in about 1 in every 500 births Occurs in about 1 in every 2000 births Occurs in about 1 in every 1500 births (c) Tetralogy of Fallot. Multiple defects (tetra = four): (1) Pulmonary trunk too narrow and pulmonary valve stenosed, resulting in (2) hypertrophied right ventricle; (3) ventricular septal defect; (4) aorta opens from both ventricles. (a) Ventricular septal defect. The superior part of the inter- ventricular septum fails to form; thus, blood mixes between the two ventricles. More blood is shunted from left to right because the left ventricle is stronger. (b) Coarctation of the aorta. A part of the aorta is narrowed, increasing the workload of the left ventricle. Figure 18.24