Download
1 / 34
390 likes | 555 Vues
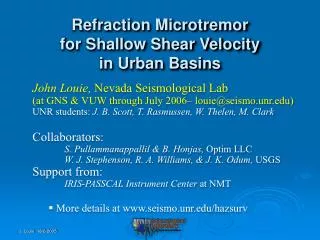
Refraction Microtremor for Shallow Shear Velocity in California Urban Basins. John Louie, Nevada Seismological Lab UNR students: J. B. Scott, T. Rasmussen, W. Thelen, M. Clark Collaborators: S. Pullammanappallil & B. Honjas, Optim LLC W. J. Stephenson, R. A. Williams, & J. K. Odum, USGS

E N D
Refraction Microtremorfor Shallow Shear Velocityin California Urban Basins • John Louie, Nevada Seismological Lab • UNR students: J. B. Scott, T. Rasmussen, W. Thelen, M. Clark • Collaborators: • S. Pullammanappallil & B. Honjas, Optim LLC • W. J. Stephenson, R. A. Williams, & J. K. Odum, USGS • Support from: • IRIS-PASSCAL Instrument Center at NMT • More details at www.seismo.unr.edu/hazsurv
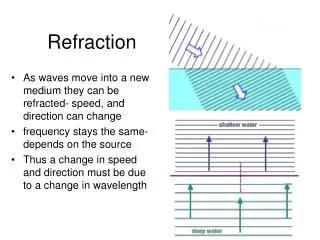
100-m depth resolution Refraction Microtremor for Shallow Shear Velocity ReMi measures Rayleigh dispersion with linear refraction arrays (paper by Louie, April 2001 BSSA). Initial funding from SCEC, UNR, VUW, Optim LLC
Refraction Microtremor for Shallow Shear Velocity What if energy arrives transverse to the linear array? Initial funding from SCEC, UNR, VUW, Optim LLC
Refraction Microtremor for Shallow Shear Velocity Majority of energy piles up close to the minimum-velocity envelope. Initial funding from SCEC, UNR, VUW, Optim LLC
Refraction Microtremor for Shallow Shear Velocity Fieldwork is quick and simple; best results in cities. Initial funding from SCEC, UNR, VUW, Optim LLC
Refraction Microtremor for Shallow Shear Velocity Low-frequencies, 1-20 Hz, so bad geophone plants still work. Initial funding from SCEC, UNR, VUW, Optim LLC
Refraction Microtremor for Shallow Shear Velocity Fieldwork is quick and simple; best results in cities. Initial funding from SCEC, UNR, VUW, Optim LLC
Refraction Microtremor for Shallow Shear Velocity Fieldwork is quick and simple; best results in cities. Initial funding from SCEC, UNR, VUW, Optim LLC
Refraction Microtremor for Shallow Shear Velocity ReMi has classified hard and soft sites around the world by measuring V30, average shear velocity to 30 m depth.
ReMi-Borehole Comparison Four deep suspension logs in Santa Clara Valley Collaboration with Stephenson, Williams, Odum (USGS), and Pullammanappallil (Optim) Refraction, MASW, and ReMi at each hole
ReMi-Borehole Comparison No surface method can match log details.
ReMi-Borehole Comparison Depth-averaged velocities are a good match. But CCOC’s LVZ is a problem.
ReMi-Borehole Comparison Joyner et al. (1981) quarter-wavelength spectra similar at important frequencies.
We Follow Field’s (2001) Amplification-Mapping Strategy Two Inputs for Microzonation: V30 and Basin Depth (Z1.5?)
B-C C-D D D-E Shallow Shear-Velocity Transects July 2003 San Gabriel Valley & Los Angeles Transect mapped on NEHRP hazard class map by Wills, from SCEC Phase 3 Report Supported by USGS, NEHRP ERP and IRIS-PASSCAL
Los Angeles Transect • Approximately 60 km in length • Followed San Gabriel River Bike Path • 20 m takeout interval, 300 m array, recorded for 30 min • 4 teams, 3 people each, 4.5 days • 120 IRIS/PASSCAL “Texan” single-channel recorders mated to a vertical 4.5-Hz geophone Supported by USGS, NEHRP ERP and IRIS-PASSCAL
Los Angeles Transect:Levee Effects • V30 levee: 245 m/s • V30 non-levee: 241 m/s
Boreholes in Open-File Reports • Four within 1 km of transect • Also an incomplete posting at ROSRINE, Pico Rivera 2
Rosrine/USGS Pico Rivera 2 • Good correlation with transect below 8 m depth.
B B-C C C-D E D D-E Measured V30 vs Wills et al. (2000) • Average measurements within ranges for classes B-C, D, and D-E • N. San Gabriel Val. Measurements average above predicted C-D range • 60 new C-D data points
V30 vs Geologic Unit • Large V30 variation inside each unit • Large V30 variation between units
V30 vs Soil Type • In general, large V30 variation within units • Units 2 and 5 may be NEHRP D • Large V30 variation between units
V30 vs Riverbank Elevation • Fast, bouldery alluvium at higher elevations on River’s alluvial fan
Noise Floor Spatial Statistics on V30 • Line in log-log spectrum means fractal • V30 less predictable as distance from measurement increases • “Noise Floor”- minimum variance reached at 700 m separation • Incorporate fractal dimension into PSHA?
Summary • ReMi allows rapid seismic shaking-hazard classification, as required by IBC2000. • Long ReMi transects can geophysically characterize spatial variations in shaking hazard. • Mapped soil and geologic units do not reliably predict the measured V30. • 210 Measurements in LA match predictions, add to class C-D data, and quantify spatial variance.
Las Vegas Transect Most of Strip, Downtown; south side of Basin only 79 sites total 1145 well logs & geologic mapping
Las Vegas Transect Some correlation to faulting, soil type?
NSL, July ‘03, sponsored by LLNL Geologic Info to Predict Vs • Can soil maps predict Vs?
Soil Stratigraphy How to Extrapolate Shallow Vs • Correlate transect measurements against Soil Map. • Correlate 75 Vs values against stratigraphic model.
How to Extrapolate Shallow Vs • Predictions are good where there are many measurements.
How to Extrapolate Shallow Vs • Predictions are not good where there only sparse measurements. • Soil map predictions are not conservative. • Stratigraphic model predictions are, at least, conservative.