Download
1 / 16
160 likes | 340 Vues
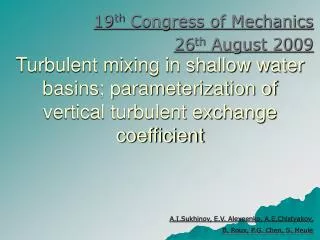
19 th Congress of Mechanics 26 th August 2009. Turbulent mixing in shallow water basins; parameterization of vertical turbulent exchange coefficient. A.I.Sukhinov, E.V. Alexeenko, A.E.Chistyakov, B. Roux, P.G. Chen, S. Meule.

E N D
19th Congress of Mechanics 26th August 2009 Turbulent mixing in shallow water basins; parameterization ofvertical turbulent exchange coefficient A.I.Sukhinov, E.V. Alexeenko, A.E.Chistyakov, B. Roux, P.G. Chen, S. Meule
Modeling of turbulence as an important mechanism in shallow water basins Turbulence in shallow water basins plays important role in many processes of hydrodynamics such as: transport and mixing heat, salt, momentum and suspended and dissolved matter Turbulent fluxes of material occur as a result of correlated, small-scale fluctuations in current velocity and the transport quantity itself
Shallow water basins we are mainly interested by shallow water basins which can be roughly characterized by the condition: kh < 1 (2π h< λ), where k -wave number of the wave,h- height of the water column, λ - wave length. Average depth of the Azov sea is about 8 m, for Etang de Berre - 6 m, what correspond to wave length – 40m . According to satellite photos wave lengths are not more than this value. The Azov sea, South of Russia The Etang de Berre, South if France Length of water basin from the west to the east/ from the south to the north : 350 km/ 250 km Maximum depth: 15 m Length of water basin from the west to the east/ from the south to the north : 19km/18km Maximum depth: 9.2m
Expeditions in the Lagoon Etang de Berre ADCP Workhorse 600 Sentinel • Depth range 70 m. • Frequency 600 kHz. • Measure precision 0,25% • Three expeditions (20Sept.2006, 28Sept.2006 and June 2008) was executed by REC oftheSouthofRussia incooperation withL3M/CNRSlaboratory (the group of Prof. B. Roux) andSIBOJAI Environmental Service in the Etang de Berre and Etang de Bolmon.
Numerical simulation of turbulent coefficient(two methods are considered) 1) method of Monin: Pulsations of velocity components was spread out in Taylor series: 1-st method 2-nd method 2) method of Belotserkovskii: Decreasing of free surface level Coefficient (m2/s)
Distributions of the coefficient of vertical turbulent exchange • Parameterisation of Belotserkovskii was included as a module in Azov3d-model for calculation evolution of 3D currents in shallow water basins. • Results of modeling were compared with results of measurements during expedition in the lagoon Etang de Berre in September 2006 Point 2 Point 5 Point 6 Decreasing of free surface level Decreasing of free surface level Decreasing of free surface level Coefficient (m2/s) blue line –result of numerical simulation, red dash line – result of measurements
MARS3Dboundary value problem for lagoon Etang de Berre Model of Mars3d adopted to shallow water basins and based on solving equations: Navier-Stokes equations +Boussinesq approximation + hydrostatic assumption for pressure + parameterization of turbulent viscosity + equations of thermodynamics calculation in σ-coordinate adopted to free surface and bottom vertical grid MARS3D for Etang de Berre (Caronte inflow, EDF, Western Wind) vector fields(palette – square of module of horizontal velocity) Barotropic flow Near free surface flow Near bottom flow
Evolution of general barotropic currents in the lagoon One day after the begining of simulation Two days after the begining of simulation Three days after the begining of simulation
Numerical vector fields superposed with results of expedition in September 2006 Qualitatively we have similar directions of currents in the place of the main vortex Vertical profiles of horizontal velocity components are similar with measurements in 4 control points (station - 2, 5, 6, 7) from 8. This result means, that we need to calibrate configuration and also to do more measurements for having data in more points of the lagoon Etang de Berre Measured currents near the free surface – red arrows, near the bottom – yellow arrows Mars3D currents near the free surface Mars3D currents near the bottom surface 4 5 6 3 8 2 1 7
Quantitative comparison of approaches of Mars3D with results of expedition With Belotserkivskii approximation With Prandt approximation With Mellor-Yamada approximation (2 eq.) near the free surface near the free surface near the free surface near the bottom near the bottom near the bottom
Application of model Mars3D with parameterization of vertical turbulent exchange Configuration of Mars3d with Belotsercovskii parameterizaton of vertical turbulent exchange was applied for research structure of currents in the lagoon Etang de Berre for understanding and solving ecological problem in this lagoon. After installation in the EDF-Channel hydroelectric-station, big volumes of fresh water are entering during last 50 years in the waters of the lagoon This change affected ecology of the lagoon. There was a strong desalination during last 50 years and many aquatic plants disappeared near coastline
TIDE, WIND and EDF-inflow + parameterization of vertical turbulent exchange in one simulationBarotropic currents associated with fast propagating waves (tide waves) wind – mistral N-NW 5 m/s, EDF-inflow (200 m3/s)
Point of Berre (zoom)TIDE, WIND and EDF-inflow in one simulationBarotropic currents associated with fast propagating waves (tide waves) wind – mistral N-NW, EDF-inflow (200 m3/s) Near the boundary where aquatic plants during last 50 years disappeared we can see intensive currents which could destroy flora of these places
Point of Berresuperposition of barocurrents and zones of Zoosteres corresponding to data of 1944, 1992, 2004(GIPREB) for NW-wind (mistral)
Simulation in the Point of Berre(resolution 1 m) Bathymetry of the Point de Berre (1m resolution), received during expedition measurements in the June 2009 by GPS (CEREGE, Samuel Meulé )
Point of Berrecurrents in the layer near the bottom (20-40 cm from the bottom)