Download
1 / 49
530 likes | 702 Vues
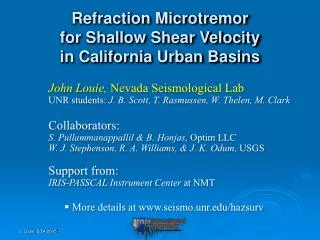
Refraction Microtremor for Shallow Shear Velocity in Urban Basins. John Louie, Nevada Seismological Lab (at GNS & VUW through July 2006– louie@seismo.unr.edu) UNR students: J. B. Scott, T. Rasmussen, W. Thelen, M. Clark Collaborators: S. Pullammanappallil & B. Honjas, Optim LLC

E N D
Refraction Microtremorfor Shallow Shear Velocityin Urban Basins • John Louie, Nevada Seismological Lab • (at GNS & VUW through July 2006– louie@seismo.unr.edu) • UNR students: J. B. Scott, T. Rasmussen, W. Thelen, M. Clark • Collaborators: • S. Pullammanappallil & B. Honjas, Optim LLC • W. J. Stephenson, R. A. Williams, & J. K. Odum, USGS • Support from: • IRIS-PASSCAL Instrument Center at NMT • More details at www.seismo.unr.edu/hazsurv
Outline Refraction Microtremor for Shallow Vs ReMi-Borehole Comparison Los Angeles Transect Las Vegas Transect Effect of Shallow Vs on Shaking Models
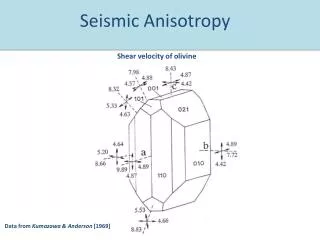
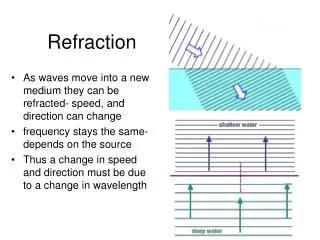
100-m depth resolution Refraction Microtremor for Shallow Shear Velocity ReMi measures Rayleigh dispersion with linear refraction arrays (paper by Louie, April 2001 BSSA). Initial funding from SCEC, UNR, VUW, Optim LLC
Refraction Microtremor for Shallow Shear Velocity Low-frequencies, 1-20 Hz, so bad geophone plants still work. Initial funding from SCEC, UNR, VUW, Optim LLC
Refraction Microtremor for Shallow Shear Velocity Fieldwork is quick and simple; best results in cities. Initial funding from SCEC, UNR, VUW, Optim LLC
Refraction Microtremor for Shallow Shear Velocity Fieldwork is quick and simple; best results in cities. Initial funding from SCEC, UNR, VUW, Optim LLC
Refraction Microtremor for Shallow Shear Velocity ReMi has classified hard and soft sites around the world by measuring V30, average shear velocity to 30 m depth.
Outline Refraction Microtremor for Shallow Vs ReMi-Borehole Comparison Los Angeles Transect Las Vegas Transect Effect of Shallow Vs on Shaking Models
ReMi-Borehole Comparison Four deep suspension logs in Santa Clara Valley Collaboration with Stephenson, Williams, Odum (USGS), and Pullammanappallil (Optim), BSSA in press Refraction, MASW, and ReMi at each hole
ReMi-Borehole Comparison No surface method can match log details.
ReMi-Borehole Comparison Depth-averaged velocities are a good match. But CCOC’s LVZ is a problem.
ReMi-Borehole Comparison Joyner et al. (1981) quarter-wavelength spectra similar at important frequencies.
Outline Refraction Microtremor for Shallow Vs ReMi-Borehole Comparison Los Angeles Transect Las Vegas Transect Effect of Shallow Vs on Shaking Models
We Follow Field’s (2001) Amplification-Mapping Strategy Two Inputs for Microzonation: V30 and Basin Depth (Z1.5?)
B-C C-D D D-E Shallow Shear-Velocity Transects July 2003 San Gabriel Valley & Los Angeles Transect mapped on NEHRP hazard class map by Wills, from SCEC Phase 3 Report Supported by USGS, NEHRP ERP and IRIS-PASSCAL
Whittier Narrows SG Mts Seal Beach • Fast bouldery alluvium near ranges • Low-velocity near-surface layers thicken toward sea • Vs constraint to 200 m depth • Z1.0 only constrained over 1/3 of transect– deep basin Los Angeles Transect: Full Section
Boreholes in Open-File Reports • Four within 1 km of transect • Also an incomplete posting at ROSRINE, Pico Rivera 2
Rosrine/USGS Pico Rivera 2 • Good correlation with transect below 8 m depth.
Los Angeles Transect: V30 Results Nearby borehole results in red
B B-C C C-D E D D-E Measured V30 vs Wills et al. (2000) • Average measurements within ranges for classes B-C, D, and D-E • N. San Gabriel Val. Measurements average above predicted C-D range • 60 new C-D data points
V30 vs Geologic Unit • Large V30 variation inside each unit • Large V30 variation between units
V30 vs Soil Type • In general, large V30 variation within units • Units 2 and 5 may be NEHRP D • Large V30 variation between units
V30 vs Riverbank Elevation • Fast, bouldery alluvium at higher elevations on River’s alluvial fan
Noise Floor Spatial Statistics on V30 • Line in log-log spectrum means fractal spatial distribution • V30 less predictable as distance from measurement increases • “Noise Floor”- minimum variance reached at 700-m separation • Incorporate fractal dimension into PSHA?
Conclusions I • Long ReMi transects can geophysically characterize spatial variations in shaking hazard. • Soil and geologic units must be specifically mapped for velocity, to reliably predict measured V30. • 210 measurements in LA match predictions, and add to class C-D data.
Outline Refraction Microtremor for Shallow Vs ReMi-Borehole Comparison Los Angeles Transect Las Vegas Transect Effect of Shallow Vs on Shaking Models
Las Vegas Shaking Computation, 2-sec E3D synthetic-seismogram code courtesy of Shawn Larsen, LLNL
Las Vegas Shaking Computation, 2-sec Las Vegas Little Skull Mtn. 33 seconds after Little Skull Mtn. earthquake, as Rayleigh wave enters Las Vegas.
Basin-depth contours in meters Las Vegas Transect Most of Strip, Downtown; south side of Basin only 79 sites total 1145 well logs & geologic mapping
Las Vegas Transect Some correlation to faulting, soil type?
NSL, July ‘03, sponsored by LLNL Geologic Info to Predict Vs • Can soil maps predict Vs?
Courtesy W. Taylor, UNLV, and J. Wagoner, LLNL Soil Stratigraphy How to Extrapolate Shallow Vs • Correlate transect measurements against Soil Map. • Correlate 75 Vs values against a stratigraphic model from 1145 water-well logs.
How to Extrapolate Shallow Vs • Predictions are good where many measurements exist.
Not Conservative Conservative How to Extrapolate Shallow Vs • Predictions are not good where there only sparse measurements. • Soil map predictions are not conservative. • Stratigraphic model predictions are, at least, conservative.
Outline Refraction Microtremor for Shallow Vs ReMi-Borehole Comparison Los Angeles Transect Las Vegas Transect Effect of Shallow Vs on Shaking Models
Deep Volcanic Rifts Las Vegas Basin Little Skull Mtn. Model Rendered as Amplification Map • Geology, Basin Depth, Geotech, Geophysical data into ModelAssembler
Deep Volcanic Rifts Las Vegas Basin Little Skull Mtn. Max. Ground Motion Computed– 0.5 Hz • E3D elastic finite-difference solution, by Shawn Larsen, LLNL
Deep Volcanic Rifts Las Vegas Basin Little Skull Mtn. Max. Ground Motion Computed– 0.1 Hz • E3D elastic finite-difference solution, by Shawn Larsen, LLNL
Las Vegas Basin Little Skull Mtn. Detailed Model Makes a Difference • Max. ground motion ratio, models with and without geotechnical model
Detailed Model Makes a Difference • But not in any way that can be predicted from the model alone– basin geometry, source, and propagation path all matter! 73% predicted for 2-4 Hz 6% computed for 0.1 Hz
Conclusions II • In tectonic areas, the regional distribution of basins affects shaking. • We have built a ModelAssemblerfor Nevada to create 3-d computation grids from geological and geotechnical data. • Surprisingly, geotechnical details affect even 10-sec computations in ways difficult to forecast.
Los Angeles Transect • Approximately 60 km in length • Followed San Gabriel River Bike Path • 20 m takeout interval, 300 m array, recorded for 30 min • 4 teams, 3 people each, 4.5 days • 120 IRIS/PASSCAL “Texan” single-channel recorders mated to a vertical 4.5-Hz geophone Supported by USGS, NEHRP ERP and IRIS-PASSCAL
Los Angeles Transect:Levee Effects • V30 levee: 245 m/s • V30 non-levee: 241 m/s
Deep Volcanic Rifts Las Vegas Basin Little Skull Mtn. Death Valley Basin Depth Model from USGS Gravity • Includes volcanic rift basins up to 9 km deep.