Download
1 / 12
120 likes | 364 Vues
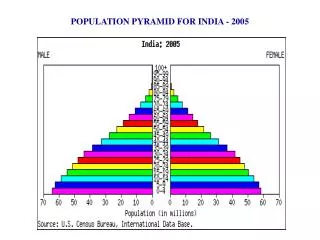
733 × 800 - www3.jjc.edu. POPULATION IN INDIA . Presented by Ezra Tiweka . POPULATION DIVERSITY. Population diversity is the different types of people according to age, sex and ethnicity. Population diversity. This graph shows the population diversity Comparison between Japan and India.

E N D
733 × 800 - www3.jjc.edu POPULATION IN INDIA Presented by Ezra Tiweka
POPULATION DIVERSITY • Population diversity is the different types of people according to age, sexand ethnicity
Population diversity This graph shows the population diversity Comparison between Japan and India. The graph indicates that in India the Population is a youthful population And people from India tend to die Earlier than people from Japan.
Population Distribution • Population distribution is where people tend to live the most in areas and why they have chosen this area to live, generally people like to live in areas which have good sources to shipping and trading, and they also tend to live around rivers for water for watering crops and drinking
Population Distribution This map shows the names of the cities and Rivers in India, this map also shows the Population of each city, this shows where all the Population is distributed and the reasons why There are more people in one city than another, For example Ahmandabad has a population of 3,959,432 and they are towards the western end Of the country, whereas Dehli has a population Of 12,918,240 because it is closer to the Ganges River and is the capital of India so the trade and Shipping would be more frequent to Dehli than Ahmandabad
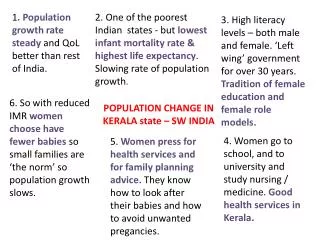
Population Change • The Equation to work out Population Change is Births – Deaths = population • Factors that influence this are; • Religion • Laws • Climate • Medical care • Diseases • Wealth • Access too food
Population Change -this graph shows how the rates of change Have changed over the years, and how more People are being born than dying now , this is Basically what population change is.
Population Migration - Population migration is where someone moves in, or Out of a country for one reason or another whether It be for a better life or for unforced reasons, to the left is A graph that shows the factors which would push or pull Someone too a certain country
Population Migrations - This photo shows some of the main reason why Indians will migrate, the photo shows an Indian At school looking as if he is quite successful, another Shows a natural disaster, another shows doctors Tending to a baby, these are some of the reasons Indians would prefer living elsewhere
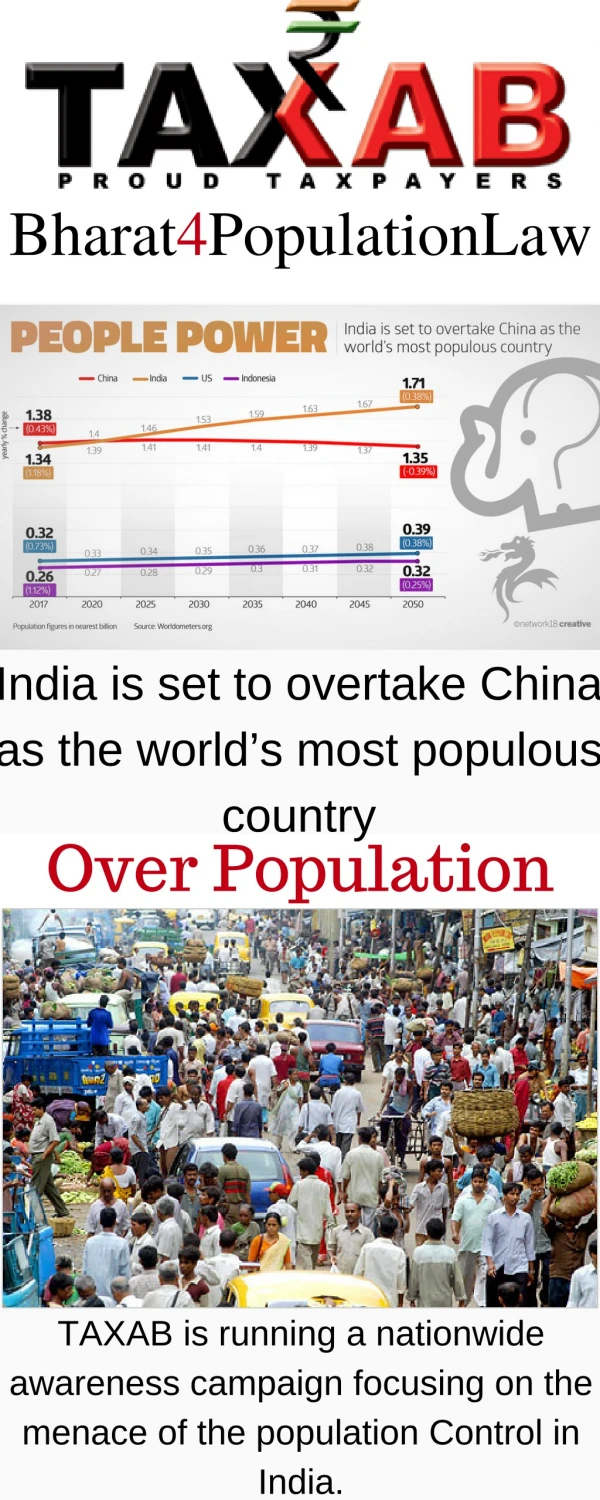
Population Sustainability • Population sustainability is when a countries environment is able to be supported into the future • New Zealand has 16ppkm and india has about 370ppkm
Population Sustainability One of the biggest changes will be the supply Of water, if india is too feed a population of 1.6 billion it will need to change thet live, but There will be no more available fresh water In 2050 than there is now. They will need to learn To use their water in ways that they can reuse it for Future generations.
Thank you for watching my show you were a good audience