
Decision Trees
E N D
Presentation Transcript
STT592-002: Intro. to Statistical Learning Decision Trees Chapter 08 (part 01) Disclaimer: This PPT is modified based on IOM 530: Intro. to Statistical Learning "Some of the figures in this presentation are taken from "An Introduction to Statistical Learning, with applications in R" (Springer, 2013) with permission from the authors: G. James, D. Witten, T. Hastie and R. Tibshirani "
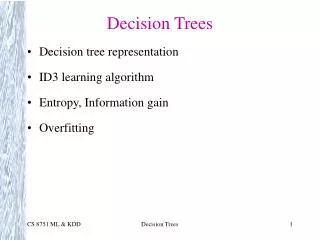
STT592-002: Intro. to Statistical Learning Outline • The Basics of Decision Trees • Regression Trees • Classification Trees • Pruning Trees • Trees vs. Linear Models • Advantages and Disadvantages of Trees
STT592-002: Intro. to Statistical Learning Regression Trees
STT592-002: Intro. to Statistical Learning Regression Trees • One way to make predictions in a regression problem is to divide predictor space (i.e. all possible values for for X1,X2,…,Xp) into distinct Regions, say R1, R2,…,Rk • Then for every X that falls in a particular region (say Rj) we make same prediction. • Eg: Suppose we have two regions R1 and R2 with • Then for any value of X such that we would predict 10, otherwise if we would predict 20. R2 R1
STT592-002: Intro. to Statistical Learning Splitting the X Variables • Generally we create partitions by iteratively splitting one of X variables into two regions. • First split on X1=t1
STT592-002: Intro. to Statistical Learning Splitting the X Variable 1. First split on X1=t1 2. If X1<t1, split on X2=t2 3. If X1>t1, split on X1=t3
STT592-002: Intro. to Statistical Learning Splitting the X Variable First split on X1=t1 If X1<t1, split on X2=t2 If X1>t1, split on X1=t3 If X1>t3, split on X2=t4
STT592-002: Intro. to Statistical Learning Splitting the X Variable • In creating partitions this way, we can always represent them using a tree structure. • This provides a very simple way to explain model to a non-expert eg. your boss!
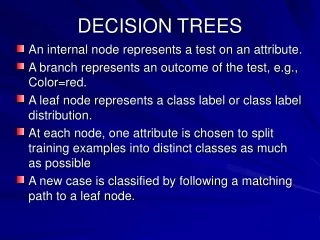
STT592-002: Intro. to Statistical Learning Three Elements in tree construction • Construction of a tree involves three elements: • 1. The selection of splits. • 2. The decisions when to declare a node terminal or to continue splitting it (internal node). • 3. Assignment of each terminal node.
STT592-002: Intro. to Statistical Learning Example: Baseball Players’ Salaries • Predicted Salary is the # in each leaf node: mean of response for observations fall there. • Note that Salary is measured in 1000s, and log-transformed • Eg: Predicted salary for a player for more than 4.5 years and had less than 117.5 hits last year is Another way of visualizing the decision tree…
STT592-002: Intro. to Statistical Learning Some Natural Questions • Where to split? i.e. how do we decide on what regions to use i.e. R1, R2,…,Rk or equivalently what tree structure should we use? • What values should we use for ?
STT592-002: Intro. to Statistical Learning 1. Where to Split? Simulation • Consider splitting into two regions, Xj>s and Xj<s for all possible values of s and j. • Choose s and j that results in lowest MSE (or SSE) on training data. Q: Now let’s try to split at the first point and find SSE. set.seed(1) x=sample(1:10, 5) y=sample(1:10, 5) plot(x,y, col="red", pch=15) cbind(x,y) #plot(1:20, 1:20, pch=1:20) A=c(1,9,10,6,5) SSE=NULL for (i in 1:4) { out=sum((A[1:i]-mean(A[1:i]))^2)+sum((A[(i+1):5]-mean(A[(i+1):5]))^2) SSE=c(SSE, out) } print(SSE)
STT592-002: Intro. to Statistical Learning Where to Split? • Optimal split on X1 at point t1. • Repeat process for next best split except that we must also consider whether to split first region or second region up. • Again criteria is smallest MSE. • Optimal split was the left region on X2 at point t2. • Continues until our regions have too few observations to continue. • e.g. all regions have 5 or fewer points.
STT592-002: Intro. to Statistical Learning 2. What values should we use for ? • Simple! • For region Rj, the best prediction is simply the average of all the responses from our training data that fell in region Rj.
STT592-002: Intro. to Statistical Learning Classification Trees
STT592-002: Intro. to Statistical Learning Growing a Classification Tree • A classification tree is very similar to a regression tree except that we try to make a prediction for a categorical rather than continuous Y. • For each region (or node), we predict most common categoryamong the training data within that region, by simple majority vote. set.seed(3) x=sample(1:10, 10, replace = FALSE) y=sample(1:10, 10, replace = FALSE) COL=sample(c("blue", "red"), 20, replace = TRUE) plot(x,y, col=COL, pch=15)
STT592-002: Intro. to Statistical Learning Growing a Classification Tree • Tree is grown (i.e. splits are chosen) in exactly same way as with a regression tree except that minimizing MSE/SSE no longer makes sense. • There are several possible different criteria to use such as “gini index” and “cross-entropy”, but easiest one to think about is to minimize the error rate. • Classification error rate, • Gini index, • or Entropy
STT592-002: Intro. to Statistical Learning Eg1: Classification error rate The classification error rate is simply the fraction of the training observation in that region that do not belong to the most common class. R1 R2 • m: m-th region; k: k-th class • Eg: m=2; k=2 • m=1: Region 1 • m=2: Region 2 • k=1: RED class • k=2: BLUE class • hat(p11) = prop of obs of RED in region 1 = 1/3 • hat(p12) = prop of obs of BLUE in region 1 = 2/3 • hat(p21) = prop of obs of RED in region 2 = 4/7 • hat(p22) = prop of obs of BLUEin region 2 = 3/7 • E1=1-max(1/3, 2/3) = 1/3 • E2=1-max(4/7, 3/7) = 3/7 • Total Error = 1/3+3/7 = 16/21=0.762
STT592-002: Intro. to Statistical Learning Gini Index and Cross-entropy The classification error rate is simply the fraction of the training observation in that region that do not belong to the most common class.
STT592-002: Intro. to Statistical Learning Eg1: Growing a Classification Tree: simulation R1 R2 • Gini Index: • For m=1: Region 1 • G1=(1/3)*(2/3) [RED] • +(2/3)*(1/3) [BLUE] • For m=2: Region 2 • G2=(4/7)*(3/7) [RED] • +(3/7)*(4/7) [BLUE] • G=G1+G2=0.934 • m: m-th region; • k: k-th class • Eg: m=2; k=2 • m=1: Region 1 • m=2: Region 2 • k=1: RED class • k=2: BLUE class
STT592-002: Intro. to Statistical Learning Eg3: Growing a Classification Tree: simulation R1 R2 • Entropy: • For m=1: Region 1 • D= • - [(1/3)*log(1/3) [RED] • +(2/3)*log(2/3) [BLUE] • +(4/7)*log(4/7) [RED] • +(3/7)*log(3/7)] [BLUE] • = 0.573 • m: m-th region; • k: k-th class • Eg: m=2; k=2 • m=1: Region 1 • m=2: Region 2 • k=1: RED class • k=2: BLUE class
STT592-002: Intro. to Statistical Learning Eg2: Classification error rate The classification error rate is simply the fraction of the training observation in that region that do not belong to the most common class. R1 R2 • m: m-th region; k: k-th class • Eg: m=2; k=2 • m=1: Region 1 • m=2: Region 2 • k=1: RED class • k=2: BLUE class • Q: To finda) The classification error rate; • b) The Gini Index; • c) The Entropy.
STT592-002: Intro. to Statistical Learning Eg2: Growing a Classification Tree: simulation R1 R2 • 1) E = 4/9 = 0.444 • 2) Gini Index: • For m=1: Region 1 • G1=0 • For m=2: Region 2 • G2=(4/9)*(5/9) [RED] • +(5/9)*(4/9) [BLUE] • G=G1+G2=0.494. • 3) D= 0.2983 • m: m-th region; • k: k-th class • Eg: m=2; k=2 • m=1: Region 1 • m=2: Region 2 • k=1: RED class • k=2: BLUE class
STT592-002: Intro. to Statistical Learning Eg2: Growing a Classification Tree: simulation Eg1: hat(p_mk) = 0.9 Eg2: hat(p_mk) = 0.5 Node impurity: a small value indicates that a node contains predominantly observations from a single class. Both Gini Index and Cross-entropy measures the node impurity. Both measurements take a small value if the m-th node is pure.
STT592-002: Intro. to Statistical Learning Node Impurity Node impurity: a small value indicates that a node contains predominantly observations from a single class. Both Gini Index and Cross-entropy measures the node impurity. Both measurements take a small value if the m-th node is pure.
STT592-002: Intro. to Statistical Learning Node Impurity • Like Gini index, entropy will take on a small value if the mth node is pure. • In fact, it turns out that the Gini index and the entropy are quite similar numerically. • When building a classification tree, either the Gini index or the entropy are typically used to evaluate the quality of a particular split, since these two approaches are more sensitive to node purity than is the classification error rate. • Any of these three approaches might be used when pruning the tree, but the classification error rate is preferable if prediction accuracy of the final pruned tree is the goal. http://faculty.marshall.usc.edu/gareth-james/ISL/ISLR%20Seventh%20Printing.pdf
STT592-002: Intro. to Statistical Learning Eg3: Growing a Classification Tree: simulation Node impurity: a small value indicates that a node contains predominantly observations from a single class. Both Gini Index and Cross-entropy measures the node impurity. Both measurements take a small value if the m-th node is pure. (0, 3/7) sum=3/7 (1/2, 3/6) sum=1 (1/3, 2/5) sum=11/15 (1/2, 1/2) sum=1 (2/5, 1/3) sum=11/15 (1/2, 1/2) sum=1 (3/7, 0) sum=3/7 http://www.stat.wisc.edu/~loh/treeprogs/guide/wires11.pdf
STT592-002: Intro. to Statistical Learning Example: Orange Juice Preference Training Error Rate = 14.75% Test Error Rate = 23.6%
Decision Tree Assume each object x is represented by a 2-dim vector x1 < 0.5 yes no x2 < 0.7 x2 < 0.3 yes no no yes The questions in training ….. Class 1 Class 1 Class 2 Class 2 number of branches, Branching criteria, termination criteria, base hypothesis Can have more complex questions http://speech.ee.ntu.edu.tw/~tlkagk/courses/ML_2016/Lecture/Ensemble%20(v6).pdf
STT592-002: Intro. to Statistical Learning Tree Pruning
STT592-002: Intro. to Statistical Learning Improving Tree Accuracy • A large tree (i.e. one with many terminal nodes) may tend to over fit training data in a similar way to neural networks without a weight decay. • Generally, we can improve accuracy by “pruning” the tree i.e. cutting off some of terminal nodes. • How do we know how far back to prune tree? We use cross validation to see which tree has lowest error rate.
STT592-002: Intro. to Statistical Learning Cost complexity pruning—also known as weakest link pruning
STT592-002: Intro. to Statistical Learning Cost complexity pruning—also known as weakest link pruning
STT592-002: Intro. to Statistical Learning Example: Baseball Players’ Salaries • The minimum cross validation error occurs at a tree size of 3 (# of terminal nodes)
STT592-002: Intro. to Statistical Learning Example: Baseball Players’ Salaries
STT592-002: Intro. to Statistical Learning Example: Baseball Players’ Salaries • Cross Validation indicated that the minimum MSE is when the tree size is three (i.e. the number of leaf nodes is 3)
STT592-002: Intro. to Statistical Learning Example: Orange Juice Preference Pruned Tree CV Tree Error Rate = 22.5% Full Tree Training Error Rate = 14.75% Full Tree Test Error Rate = 23.6%
STT592-002: Intro. to Statistical Learning Trees vs. Linear models
STT592-002: Intro. to Statistical Learning Trees vs. Linear Models • Which model is better? • If relationship b/w predictors and response is linear, then classical linear models such as linear regression would outperform regression trees. • On the other hand, if relationship between the predictors is non-linear, then decision trees would outperform classical approaches
STT592-002: Intro. to Statistical Learning Trees vs. Linear Model: Classification Example • Top row: the true decision boundary is linear • Left: linear model (good) • Right: decision tree • Bottom row: the true decision boundary is non-linear • Left: linear model • Right: decision tree (good)
STT592-002: Intro. to Statistical Learning Advantagesand disadvantages of trees
STT592-002: Intro. to Statistical Learning Pros and Cons of Decision Trees • Pros: • Trees are very easy to explain to people (probably even easier than linear regression) • Trees can be plotted graphically, and are easily interpreted even by non-expert • They work fine on both classification and regression problems • Cons: • Trees don’t have the same prediction accuracy as some of more complicated approaches that we examine in this course • Trees can be very non-robust. Small changes in data can cause large change in final estimated tree.
STT592-002: Intro. to Statistical Learning STT215 review Distribution of X; Sampling distribution of x-bar; Sampling distribution of p-hat;
Summary: Chap 2 and Chap6. With 60 5th grade students Take: X=IQ scores. Then X follows Normal Dist: X ~ N(m,s). relative frequencies=.303 area = .293
X-bar=sample mean. Sampling dist of X-bar is given: Summary: Chap 7.2. sampling dist of X-bar
P-hat=sample prop of even #. Sampling dist of p-hat is given: Summary: Chap 7.1. sampling dist of p-hat
Chap7.1: Sampling dist. of sample Prop = Distribution of Chap6: Distribution of X: Q: To find Probability with common three steps: Step 1. Standardize; That is, to find Z-score; Step2: Draw N(0, 1) and shade; Step3: Find: Prob=Area =NCDF(low, high, 0, 1) Let X=height or height. X ~ N(m,s) N(0,1) Standardized height (no units) Chap7.2: Sampling dist. of sample Mean = Distribution of