Download
1 / 13
130 likes | 238 Vues
PREMIUMS Growth in P/C NPW Highly Cyclical. 1985-87. 2001-03. 1975-78. Real NWP Growth During Past 3 Hard Markets 1975-78: 8.6% 1985-87: 14.5% 2001-03F: 8.8%. Note: Shaded areas denote hard market periods. Source: A.M. Best, Insurance Information Institute.

E N D
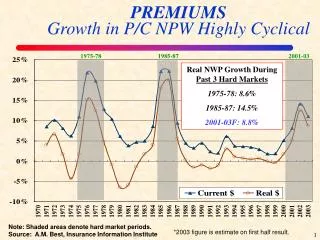
PREMIUMSGrowth in P/C NPW Highly Cyclical 1985-87 2001-03 1975-78 Real NWP Growth During Past 3 Hard Markets 1975-78: 8.6% 1985-87: 14.5% 2001-03F: 8.8% Note: Shaded areas denote hard market periods. Source: A.M. Best, Insurance Information Institute *2003 figure is estimate on first half result.
CAPACITYExcess Liability Market Capacity is Cyclical, Like Other Segments Capacity has dropped 30% since peaking in 2000 Source: Marsh, 2003 Limits of Liability Report, III
PERFORMANCEP/C Industry Combined Ratio Highly Cyclical Combined Ratios 1970s: 100.3 1980s: 109.2 1990s: 107.7 2000s: 111.0 2001 = 115.7 2002 = 107.2 2003First Half = 99.8 *Based on First Half 2003 results. Sources: A.M. Best; ISO, III
Interest Rates and Underwriting Profits • Assumptions: • No risk, no inflation, no expense loading • Real rate is 1.25% • Policy pays off $100 one year from now • Premium= $100/1.0125 = $98.77 • Underwriting profit= $98.77-100 = -$1.23 • Underwriting profit ratio = -.012
Interest Rates and Underwriting Profits • Assumptions: • Same but now 3% inflation • Loss= $100*1.03 = $103 • Discount rate = 1.0125*1.03=1.043 • Premium= $103/1.043 = $98.77 • Underwriting profit= $98.77-103 = -$4.23 • Underwriting profit ratio = -.043
PROFITSP/CROE Volatile but is itStill Cyclical? *First Half 2003 Source: Insurance Information Institute; ISO, III
RESERVE DEVELOPMENT:Why is ReserveDevelopment Cyclical? Adverse reserve development of about $23 billion accounted for most of the industry’s 2002 underwriting loss and “ate” much of the industry’s $37 billion increase in earned premiums *Negative numbers indicate favorable development; positive figures represent adverse development. Source: A.M. Best, Morgan Stanley, Dowling & Partners Securities, III
PERFORMANCELine-Specific Cyclicality (WC) 2.9 pts due to 9/11 *Includes dividends to policyholders Accident year is developed to ultimate as 12/31/02; Note: CY figures from AM Best; AY figures from NCCI Source: A.M. Best, NCCI, III
INSOLVENCIESP/C Company Insolvency Ratesare Cyclical • Insurer insolvencies are increasing • 10-yr industry failure rate: 0.72% • Failure rating for B+ or better rating: 0.49% • Failure rate for D through B rating: 1.29% 10-yr Failure Rate = 0.72% 30 30 38 Source: A.M. Best; Insurance Information Institute
RATINGSAre P/C Insurer Ratings Cyclical? Upgrades / Downgrades: North America Source: Moody’s, III
CAPITALP/C PHS Exhibiting Cyclicality $47 Billion • Surplus (capacity) peaked at $336.3 Billion in mid-1999 and fell by 15.5% ($52 billion) to $284.3 billion at year-end 2002 (a trough?) • Surplus during the first half of 2003 rose by $28.2B or 9.9% to $312.5B $ Billions “Surplus” is a measure of underwriting capacity. It is analogous to “Owners Equity” or “Net Worth” in non-insurance organizations Source: A.M. Best, Insurance Information Institute, III *First Half
INTERNATIONALCyclicality Exists Internationally in Investor Perceptions Source: Kielholz, Walter, “The Cost of Capital for Insurance Companies,” The Geneva Papers on Economic Activity, v 25, no. 1, January 2000, III
PRICINGCommercial Premium Rate Changes Highly Cyclical • Pricing cycle appears to be alive and well • Is moderation due to realization of performance and profit goals, increasing capacity/capital, or market share strategies? Source: MarketScout.com, III