Maximizing Market Surplus: An Economic Analysis
80 likes | 165 Vues
Explore the impact of introducing a new good on market surplus, costs of protection, and producer revenue in the context of economic models. Understand how import restrictions affect operating profits and long-term costs.

Maximizing Market Surplus: An Economic Analysis
E N D
Presentation Transcript
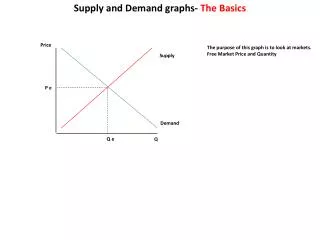
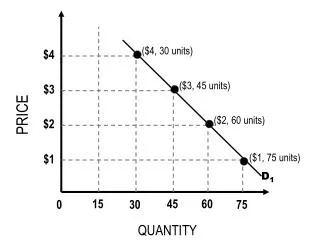
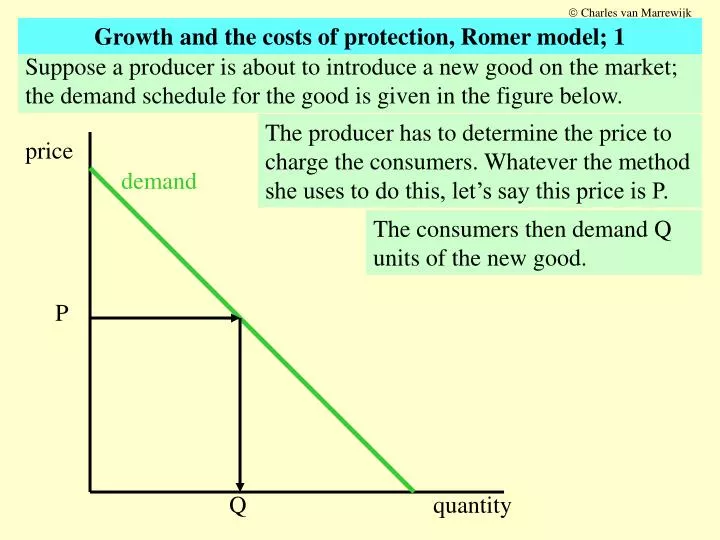
Charles van Marrewijk price quantity Growth and the costs of protection, Romer model; 1 Suppose a producer is about to introduce a new good on the market; the demand schedule for the good is given in the figure below. The producer has to determine the price to charge the consumers. Whatever the method she uses to do this, let’s say this price is P. demand The consumers then demand Q units of the new good. P Q
Charles van Marrewijk Growth and the costs of protection, Romer model; 2 The value to consumers of Q units of the new good is represented by the area under the demand curve. The revenue for the producer, what she can use to recover her cost, is only P*Q price demand The difference between the value to the consumers and the revenue for a producer is a surplus generated by the market. So what are the costs of NOT introducing a new good on the market? P They can be represented by the DUPUIT triangle measuring market surplus. Q quantity
Charles van Marrewijk Growth and the costs of protection, Romer model; 3 Imagine a small developing economy that depends on R&D in the rest of the world for developing new types of capital goods. The capital goods are indexed by i = 1,..,N; the volume of capital good i imported is xi; the country has L labor available; output is Y and the production function is given by: The producers in the small developing economy are price takers, while the producers of capital goods are engaged in monopolistic price competition; they thus charge twice the marginal cost of production and earn operating profits [p(1-1/) = MC; = 1/0.5 = 2]. The marginal costs are the same for all producers (so they all charge the same price), but the fixed cost of introducing the capital good on the market of the small developing economy varies from one producer of capital goods to another: we arrange them such that the fixed introduction costs increase with i, say linearly.
Charles van Marrewijk The costs of introducing new varieties Introduction costs profits rises with i (by construction) i Growth and the costs of protection, Romer model; 4 We can draw a diagram of operating profits and introduction costs. We depict the operating profits as a horizontal line because they are the same for all producers of capital goods. The point of intersection determines which capital goods will be profitable to introduce and which will not, that is it determines N N
Charles van Marrewijk i Growth and the costs of protection, Romer model; 5 What happens if the small developing country imposes import restrictions, say a tax tau on the purchases of foreign goods? It lowers the revenue for producers of capital goods to (1-tau)*p*x Thus operating profits fall. We now distinguish between 2 different scenarios: Introduction costs profits The ‘surprise’ scenario, which we will associate with short term and the ‘expected’ scenario, which we will associate with long term cost of protection. N
Charles van Marrewijk i Growth and the costs of protection, Romer model; 6 In the ‘surprise’ scenario the tax is imposed after the producers of capital goods have made their entry decision. The number of capital goods introduced on the market remains N The ‘surprise’ tax implies some of the producers of capital goods will make a loss; it is still the best they can do in the new situation because the introduction costs are sunk cost. Introduction costs profits It turns out that the production loss for the developing economy of the tax is then given by: tau2. N
Charles van Marrewijk i Growth and the costs of protection, Romer model; 7 In the ‘expected’ scenario the producers know that the tax is introduced before they make their entry decision. The number of capital goods introduced on the market falls as a consequence of the tax (from N to N) It turns out that the production loss for the developing economy of the tax is then given by: 2*tau-2*tau3+tau4. Introduction costs profits NB 1: the introduction of new capital goods raises productivity; NB 2: this is an example only. N N
Charles van Marrewijk Growth and the costs of protection; 8