Download
1 / 28
290 likes | 414 Vues
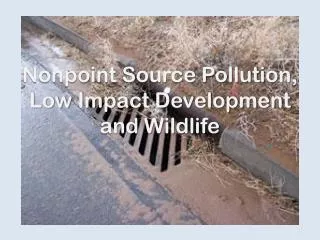
Nonpoint Source Success Stories: Linking Projects with Water Quality Improvement. Steve Epting, ORISE Fellow US EPA – Office of Wetlands, Oceans, and Watersheds Nonpoint Source Control Branch. Discussion Outline. Overview of NPS success stories What is eligible?

E N D
Nonpoint Source Success Stories: Linking Projects with Water Quality Improvement Steve Epting, ORISE Fellow US EPA – Office of Wetlands, Oceans, and Watersheds Nonpoint Source Control Branch
Discussion Outline • Overview of NPS success stories • What is eligible? • How does US EPA use this information? • What do 270+ success stories tell us about “success”? • Role of NPS Monitoring • Available resources • Examples of innovative state approaches to address NPS monitoring needs
Success Stories reflect the most common causes and sources of impairment (Rivers & Streams - 2010) Top 5 Causes • Pathogens • Sediment • Nutrients • Organic Enrichment/Oxygen Depletion • Polychlorinated Biphenyls (PCBs) Top 5 Probable Sources Agriculture Atmospheric Deposition Unknown Hydromodification Urban-Related Runoff/Stormwater
NPS Success Story Options Type 1 (WQ-10): Fully or Partially Restored Waters • Must have been listed as impaired during 1998/2000 listing cycle or later • Tracked on segment (waterbody) basis • Current Tally = 433 waterbodies • WQ has improved due to actual NPS pollution control or restoration efforts. • Improvements must be documented *High bar = documenting attainment of WQS
List of Impaired waters 303(d)
LOCAL Example: Alabama’s Flint River(Type 1: Fully or Partially Restored) • Lower mainstem listed as impaired in 1998 for DO/organic enrichment due to agricultural activities and urbanization • Agricultural BMPs (winter cover, conservation tillage, livestock protection, nutrient plans) and education/outreach efforts in early 2000’s • 28-mile segment removed from impaired waters list in 2006 (partially restored)
NPS Success Story Options *These stories do not count towards WQ-10, but are published on the Success Story website: Type 2: Waters Showing Measurable Progress • Listed as impaired • Show progress towards meeting WQ goals • Do not yet meet WQ standards Type 3: Waters Showing Ecological Restoration • Waterbody had WQ problems (but were not listed on 303(d) or on the Integrated Report); restoration efforts restored one or more uses.
Example: Maryland’s Bens Branch/Lake Linganore (Type 2: Showing Measurable Progress) BEFORE • Lake Linganore listed in 1996 for sediment and nutrients • Partners implemented agricultural BMPs and stabilized streambanks (Bens Branch). • Results: Sediment and phosphorus levels declined, but do not yet meet standards. AFTER
Example: MA’s Winsegansett Marsh(Type 3: Showing Ecological Restoration) BEFORE • Development reduced flow between marsh and Buzzards Bay, causing salinity to decline • Salt-intolerant species (invasive common reed) began to dominate plant community • Project partners increased tidal exchange by four existing culverts with larger ones • Led to decrease in salt-intolerant, invasive species; increase in native salt marsh grasses Photo Credit: Buzzards Bay NEP AFTER
Common Attributes of NPS Success Stories • Practices target specific nonpoint sources • Planning: TMDL, watershed-based plan • Section 319 funds support planning and/or implementation (sometimes staff support) • Multiple project partners involved (local, state, federal) • WQ monitoring data (and photos) showing improvement
How does EPA use success story information? • National Water Program Guidance. Helps direct state efforts to document NPS results. • Highlight “best practices” where restoration efforts have resulted in water quality improvement, e.g., coordination with partner agencies • Respond to Congressional inquiries and coordinate with EPA management (e.g., organizing site visits) Chehalis River Basin, WA
Role of NPS Monitoring in Determining WQ-10 “Success” BEFORE AFTER Muddy Creek, WY
Resources to Support NPS monitoring • State ambient monitoring program, but…competing resource demands and issues of scale • CWA Section 106 funds • CWA Section 319 funds • General NPS monitoring; project effectiveness monitoring • Other federal/state partners - USGS • Volunteer Monitoring Networks • Wisconsin’s Citizen Based Monitoring Program • Virginia’s Save our Streams Program
NPS Monitoring and WQ-10 “Success” • State must demonstrate that NPS-impaired waterbody now meets WQS for one or more pollutant or designated use. • State defines “success” through state WQS • Relies on significant investment in NPS monitoring • Pre-project monitoring for 305(b)/303(d) state program, watershed characterization and TMDL/watershed-based plan development, including ID of NPS critical areas • During/post-project monitoring to assess project effectiveness, water quality trends, and eligibility for impairment delisting • National NPS Monitoring Program estimates total project period of 10+ years: Baseline monitoring (2+ years) + BMP implementation (3-5 years) + post-project monitoring (3+ years)
Addressing NPS Monitoring Needs:Oklahoma Conservation Commission
Year 1/6 Year 2/7 Year 3/8 Year 4/9 Year 5/10 Oklahoma Conservation Commission Rotating Basin Monitoring Program • 245 ambient monitoring sites; each station sampled every 5 weeks for period of 2 years • Fixed stations upstream of permitted discharges, reservoirs, confluences, etc. to focus on NPS • Focus on pollutants for which the state has quantitative water quality standards, also includes nutrients • Funded primarily with CWA Section 319 Additional 250 probabilistic sites monitored every 5 years
Oklahoma Conservation Commission • In NPS Priority Watersheds (319 project areas), a paired watershed monitoring program monitors load reduction of critical parameters • This monitoring has shown up to 60 – 70% reductions in-stream nutrient loading within 4 – 7 years of beginning implementation
Bull Creek- NE OK • 31,175 acre watershed • 17 mile creek • Land use primarily pasture land • Wheat, corn, and cattle production • 303(d) listed in 2002 for turbidity, fecal bacteria, and dissolved oxygen
Bull Creek • Conservation Practice funding • EQIP and CSP invested approx. $277,936 • Conservation Districts provided approx. $14,085 and landowners $16,528 through the state cost-share program • Practices installed included: • Pasture and rangeland planting on 169 acres • Brush management on 908 acres • Pest management on 3,431 acres • Forage harvest management on 281 acres • Prescribed grazing on 7,436 acres • 4,171 feet cross-fencing • 10 ponds • Conservation crop rotation on 216 acres • Conservation tillage on 948 acres • Nutrient management plans on 417 acres • 12,550 feet of terraces
Bull Creek - Water Quality Results • EPA 319 funded water quality monitoring has documented significant improvements in turbidity and E. coli bacteria. • Bull Creek was delisted from OK’s 303(d) list for turbidity and E. coli in 2010.
Ohio EPA • State conducted NPS program evaluation in 2007 to assess use of 319 funding. • Found that monitoring costs frequently exceeded 319 project implementation • Beginning in FY08, OEPA staff conducted all monitoring for 319 projects (no 319 subgrants for monitoring)
OEPA 319 Project Monitoring Team Environmental Specialist (FISH) Environmental Specialist (BUGS) 2 College Interns (FISH) 1 College Intern (BUGS) Total Cost: about $53,000/yr
QHEI Habitat Assessment ICI Bugs Assessment IBI Fish Assessment OEPA 319 Project Monitoring Team 75 Sampling Sites/Year 5 Sites/Project 15 Projects/Year
Benefits Cost Savings All Level 3 Credible Data All Data STORET Compatible One QAPP Project & Watershed Specific
Questions related to NPS success stories or WQ-10? Steve Epting – EPA Nonpoint Source Control Branch epting.steven@epa.gov