
Innovations in Hearing Aid Gain Verification and Output Mapping
Explore the evolution of hearing aid gain verification from functional gain to insertion gain and modern insitu output mapping. Discover the changing approaches and technologies employed in ensuring optimal aided speech output quality.

Innovations in Hearing Aid Gain Verification and Output Mapping
E N D
Presentation Transcript
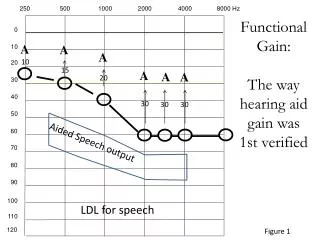
250 500 1000 2000 4000 8000 Hz Functional Gain: The way hearing aid gain was 1st verified 0 A A 10 A 10 20 15 A A A 20 30 40 30 30 30 50 60 Aided Speech output 70 80 90 100 LDL for speech 110 120 Figure 1
Then Came Insertion Gain: Aided vs Unaided SPL at the TM 120 * 110 REAR REUR Target REIG dB SPL at TM 100 90 80 70 60 50 40 * 30 * * 20 dB Gain * * 10 * 0 250 500 1000 2000 4000 8000 Frequency Figure 2
Today we use Insitu Output: Map Soft, Average, Loud speech into remaining Dynamic Range 120 * * * 110 * * * * * 100 dB SPL at TM 90 80 70 60 50 40 30 LDL * * * Normal HL * * * Targets: Loud Average Soft 20 * * * * * 10 * 0 250 500 1000 2000 4000 8000 Frequency Figure 3


