Download
1 / 32
340 likes | 689 Vues
Module 13: Gage R&R Analysis – Analysis of Repeatability and Reproducibility

E N D
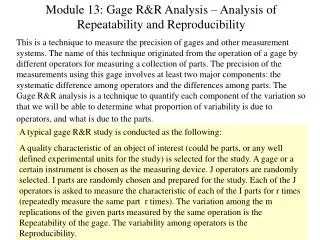
Module 13: Gage R&R Analysis – Analysis of Repeatability and Reproducibility This is a technique to measure the precision of gages and other measurement systems. The name of this technique originated from the operation of a gage by different operators for measuring a collection of parts. The precision of the measurements using this gage involves at least two major components: the systematic difference among operators and the differences among parts. The Gage R&R analysis is a technique to quantify each component of the variation so that we will be able to determine what proportion of variability is due to operators, and what is due to the parts. A typical gage R&R study is conducted as the following: A quality characteristic of an object of interest (could be parts, or any well defined experimental units for the study) is selected for the study. A gage or a certain instrument is chosen as the measuring device. J operators are randomly selected. I parts are randomly chosen and prepared for the study. Each of the J operators is asked to measure the characteristic of each of the I parts for r times (repeatedly measure the same part r times). The variation among the m replications of the given parts measured by the same operation is the Repeatability of the gage. The variability among operators is the Reproducibility.
Gage repeatability and reproducibility studies determine how much of your observed process variation is due to measurement system variation. The overall variation is broken down into three categories: part-to-part, repeatability, and reproducibility. The reproducibility component can be further broken down into its operator, and operator by part, components. Pat-to-Part Variation Variation due to Gage Overall Variation Repeatability Measurement System Variation Operators Variation due to Operators Reproducibility Operator by Part
Case Study (Data are from Vardeman & Jobe (1999): A study was conducted to investigate the precision of measuring the heights of 10 steel punches (in 10-3 inches) using a certain micrometer caliper. Three operators were randomly selected for the the study. Ten parts with steel punches are randomly selected. Each operator measured each punch three time. Here are the data. Row Punch OperA OperB OperC 1 1 496 497 497 2 1 496 499 498 3 1 499 497 496 4 2 498 498 497 5 2 497 496 499 6 2 499 499 500 7 3 498 497 496 8 3 498 498 498 9 3 498 497 497 10 4 497 496 498 11 4 497 496 497 12 4 498 499 497 13 5 499 499 499 14 5 501 499 499 15 5 500 499 500 Row Punch OperA OperB OperC 16 6 499 500 498 17 6 498 499 498 18 6 499 497 498 19 7 503 498 500 20 7 499 499 499 21 7 502 499 502 22 8 500 501 500 23 8 499 498 501 24 8 499 499 499 25 9 499 500 500 26 9 500 500 499 27 9 499 498 500 28 10 497 500 496 29 10 496 494 498 30 10 496 496 496
The Repeatability is the uncertainty among replications of m measurements of a given part made by the an operator. Since part and operator are fixed, the variance component for the repeatability is the random error, s2. On the other hand, the reproducibility is the uncertainty among operators for measuring the same part. Therefore, the variance component for the reproducibility is How to estimate these variance components?
Two ways to determine these variance components: • X-bar & R-chart approach.: can be done by hand, but it less accurate. • ANOVA approach : Computer will be handy. We will discuss both approaches Our goal is to estimate Repeatability is the variation due to random error introduced by the differences of the repeated measurements of the same part by the same operator. That is this the variation among: Yij1, yij2, …yijr The range Rij can be easily obtained and applied to estimate this variability (recall the X-bar & R-charts): E(Rij) = d2(r)s . Therefore,
The following is the Rij’s for the Measured Punch Heights The average range is __________ And d2(r=3) = _________ Therefore, 1.9, 1.693, 1.12
Determine the reproducibility Reproducibility measures the uncertainty among operators for a given part. This uncertainty is closely related to the range:
For the Punch Height case study, the following table gives the measurement means of ith part by the jth operator: 0
Using ANOVA approach, we have the following results: (to be shown by computer output) NOTE: Recall from Module 12, This is two random effect factor model with applications to repeatability and reproducibility
Overall Uncertainty of the Gage under evaluation when it is used to produce measurements To sum up the discussion of this Gage R&R Analysis, the final goal is to determine the uncertainty of the gage, and determine the capability of the gage. This information will be taken for further study of possible calibration study or for setting up quality control procedure to ensure the gage to be ‘capable’, that is , to ensure the expanded uncertainty is within a certain range with a high level of confidence (95%, 99% or higher).
The multiple, 6, is chosen based on normal distribution so that 99.5% of chance the measurements will covered. The estimate overall uncertainty is the most current condition of the instrument. Therefore, If GCR > 1, it indicates that the current condition is out of specs, and some adjustment or calibration of the instrument may be necessary. The current condition can also be presented as How to determine the capability of a gage?
In many cases, one may be interested in repeatability and reproducibility components separately, and present each in terms of %GCR for Repeatability, %GCR for Reproducibility. A simple guideline can then be determined to monitor the instrument (gage or system). One common guideline used in industry is: If %GCR Repeatability > 5%, a yellow warning sign is flagged. If %GCR Repeatability > 10%, a red sign is flagged, and an immediate attention is needed for instrument adjustment or calibration. Similarly, one can set up a flag system for reproducibility. If If %GCR Repeatability > 20%, a yellow warning sign is flagged. If %GCR Repeatability > 30%, a red sign is flagged, and an immediate action is needed for operator retraining or monitoring the process produces the parts.
Two Types of Gage R&R Experimental Designs Gage R&R (Crossed): When the same parts are used cross the entire study. That is every operator measures the same parts.In experimental design language, this is a two-factor factorial design with both factors are random effect factors. The two factors are Operators and Parts. The statistical model is
Gage R&R (Nested): In cases where one part can only be measured once. Once it is used, it can no longer be used. In this case, parts are nested within operator. Each operator measures different sets of parts. It is important to choose the parts (the experimental units) as homogeneous as possible, so that the variability due to operator reflects the uncertainty of operators not because of the different parts being used by different operators. The statistical model describes this design is a two nested random effects model :
Use Minitab to perform the analysis for the Punch Height Case Study Minitab provides two methods for Gage R&R(Crossed Design) : Xbar and R, or ANOVA, one method for the Gage R&R (Nested Design): ANOVA method. In addition, there is a Gage R&R Run Chart tool to show the measurements for each operator from part to part. • Data Preparation: Gage R& R data must be arranged in three columns: One for Operator ID, one for Part number and one for the measurement. If the data originally are created as each operator’s measurement is entered in one column (eg., C1 for Parts Number, C2 for the measurement of Operator 1, C3 for Operator 2 and C4 for Operator 3), then data have to be ‘STACKED’ together. Steps of using Minitab to ‘Stack’ several columns into one: • Go to Manip, choose ‘Satck’, select ‘Stack Columns’. • In the dialog box, enter column # where the new stacked column will be, and the corresponding index column as the subscripts.
Before running the Gage R&R analysis, you need to decide if the design is a ‘crossed factorial design’, or ‘a nested design’ by checking if the same parts are used by each operator (Crossed) or different parts are use by each operator (Nested). • Gage R&R (Crossed Design): • Go to Stat, go to Quality Tools, choose Gage R&R Study (Crossed). • In the dialog box, enter the Columns for Part Operator and Measurement. Choose the Method – Either ANOVA or Xbar-R. • There are two selections: Gage Infor is for keeping track of the Gage information. Options is for Tolerance Analysis. In the uncertainty study, this is irrelevant. • However, if one is conducting a quality control monitoring, this provides the information about the process tolerance and how it is compared with a given tolerance range. In the box: “study Variation is 5.15 by default, 5.15x(s.d.), which is designed to cover 99% of all possible values (NOTE 5.15 = 2(z(.005)). Under normal curve, 5.15(s.d.) covers approximately 99% of the data values). One can choose different multiple for difference level of confidence.
The following graph is from the Gage Run Chart Procedure. In Minitab, go to Stat, choose Quality Tools, selcet Gage Run Chart, then enter columns numbers for Part, Operator, and Measurement.
Gage R&R Study - XBar/R Method for Height %Contribution Source Variance (of Variance) Total Gage R&R 1.26136 50.22 Repeatability 1.25949 50.15 Reproducibility 0.00188 0.07 Part-to-Part 1.25015 49.78 Total Variation 2.51151 100.00 StdDev Study Var %Study Var Source (SD) (5.15*SD) (%SV) Total Gage R&R 1.12310 5.78398 70.87 Repeatability 1.12227 5.77968 70.82 Reproducibility 0.04331 0.22304 2.73 Part-to-Part 1.11810 5.75821 70.55 Total Variation 1.58477 8.16158 100.00 Number of distinct categories = 1
Gage R& R Analysis – ANOVA Method Two-Way ANOVA Table With Interaction Source DF SS MS F P Part 9 122.400 13.6000 14.9268 0.00000 Operator 2 2.489 1.2444 1.3659 0.28037 Operator*Part 18 16.400 0.9111 0.6260 0.86484 Repeatability 60 87.333 1.4556 Total 89 228.622 Two-Way ANOVA Table Without Interaction Source DF SS MS F P Part 9 122.400 13.6000 10.2262 0.00000 Operator 2 2.489 1.2444 0.9357 0.39666 Repeatability 78 103.733 1.3299 Total 89 228.622
If the specs for the gage is What is the GCR? What is the %GCR for Repeatability? Does the gage need calibration? If the specs for the gage is What is the GCR? What is the %GCR for Repeatability? Does the gage need calibration? Gage R&R (BY ANOVA Method – Crossed Design) %Contribution Source VarComp (of VarComp) Total Gage R&R 1.3299 49.38 Repeatability 1.3299 49.38 Reproducibility 0.0000 0.00 Operator 0.0000 0.00 Part-To-Part 1.3633 50.62 Total Variation 2.6933 100.00 StdDev Study Var %Study Var Source (SD) (5.15*SD) (%SV) Total Gage R&R 1.15322 5.93908 70.27 Repeatability 1.15322 5.93908 70.27 Reproducibility 0.00000 0.00000 0.00 Operator 0.00000 0.00000 0.00 Part-To-Part 1.16762 6.01326 71.15 Total Variation 1.64111 8.45174 100.00 Number of Distinct Categories = 1
Gage R&R (Nested Design) The same Punch Height Case Study is use to demonstrate the Nested Model – Assuming the steel punches can only be measured once by an operator. In this set up, we need to prepare 30 different experimental units, in stead of 10. Gage R&R (Nested) for Height Nested ANOVA Table Source DF SS MS F P Operator 2 2.489 1.24444 0.24207 0.78668 Part (Operator) 27 138.800 5.14074 3.53181 0.00002 Repeatability 60 87.333 1.45556 Total 89 228.622
Gage R&R (Nested Model) %Contribution Source VarComp (of VarComp) Total Gage R&R 1.45556 54.23 Repeatability 1.45556 54.23 Reproducibility 0.00000 0.00 Part-To-Part 1.22840 45.77 Total Variation 2.68395 100.00 StdDev Study Var %Study Var Source (SD) (5.15*SD) (%SV) Total Gage R&R 1.20646 6.21329 73.64 Repeatability 1.20646 6.21329 73.64 Reproducibility 0.00000 0.00000 0.00 Part-To-Part 1.10833 5.70790 67.65 Total Variation 1.63828 8.43713 100.00 NOTE: No Operator by Part Interaction
Use of General Linear Model Approach to Analyze the Punch Height Gage R&R data General Linear Model: Height versus Operator, Part Factor Type Levels Values Operator random 3 OperA OperB OperC Part random 10 1 2 3 4 5 6 7 8 9 10 Analysis of Variance for Height, using Adjusted SS for Tests Source DF Seq SS Adj SS Adj MS F P Operator 2 2.489 2.489 1.244 1.37 0.280 Part 9 122.400 122.400 13.600 14.93 0.000 Operator*Part 18 16.400 16.400 0.911 0.63 0.865 Error 60 87.333 87.333 1.456 Total 89 228.622 Unusual Observations for Height Obs Height Fit SE Fit Residual St Resid 3 499.000 497.000 0.697 2.000 2.03R 20 499.000 501.333 0.697 -2.333 -2.37R 42 499.000 497.000 0.697 2.000 2.03R 58 500.000 496.667 0.697 3.333 3.38R 59 494.000 496.667 0.697 -2.667 -2.71R
Expected Mean Squares, using Adjusted SS Source Expected Mean Square for Each Term 1 Operator (4) + 3.0000(3) + 30.0000(1) 2 Part (4) + 3.0000(3) + 9.0000(2) 3 Operator*Part (4) + 3.0000(3) 4 Error (4) Error Terms for Tests, using Adjusted SS Source Error DF Error MS Synthesis of Error MS 1 Operator 18.00 0.911 (3) 2 Part 18.00 0.911 (3) 3 Operator*Part 60.00 1.456 (4) Variance Components, using Adjusted SS Source Estimated Value Operator 0.01111 Part 1.40988 Operator*Part -0.18148 Error 1.45556 The EMS provides information for determining how we should conduct the F-test. Source(1) Operator is tested by suing Source (3) as Error Term. Source (2) Part uses Source (3) as the Error Term. Source (3) Operator*Part uses the Source (4) Random Error as the Error Term.
Variance Components, using Adjusted SS Source Estimated Value Operator 0.01111 Part 1.40988 Operator*Part -0.18148 Error 1.45556 Least Squares Means for Height Operator Mean OperA 498.5 OperB 498.1 OperC 498.4 Part 1 497.2 2 498.1 3 497.4 4 497.2 5 499.4 6 498.4 7 500.1 8 499.6 9 499.4 10 496.6 NOTE: The estimated Variance Component for Operator*Part is Negative! This is not realistic in real world applications. If it is negative, the value zero is usually taken.
In a system of a sequence of operations, one process is to measure the angle at which fibers are glued to a sheet of base material. The correct angle is extremely important in the later processes. A Gage R&R project is determined to study the uncertainty of the degree of the angle. A team of four members are chosen for the study. Each team member measures five specimens for three times. The same five specimens are used through the the project. The tolerance specification is The measurements are recorded in the following table. Conduct a through analysis of Gage R&R study and prepare a summary report of the findings. Hands-on Project for Gage R&R Analysis (Data Source: Vardeman & Jobe, 1999)
Row Anal Speci Angle 1 1 1 23 2 1 1 20 3 1 1 20 4 1 2 17 5 1 2 20 6 1 2 20 7 1 3 23 8 1 3 20 9 1 3 22 10 1 4 16 11 1 4 22 12 1 4 15 13 1 5 20 14 1 5 20 15 1 5 22 16 2 1 20 17 2 1 25 18 2 1 17 19 2 2 15 20 2 2 13 21 2 2 16 22 2 3 20 23 2 3 23 24 2 3 20 25 2 4 20 26 2 4 22 27 2 4 18 28 2 5 18 29 2 5 20 30 2 5 18 31 3 1 20 32 3 1 19 33 3 1 16 34 3 2 15 35 3 2 20 36 3 2 16 37 3 3 15 38 3 3 20 39 3 3 22 40 3 4 17 41 3 4 18 42 3 4 15 43 3 5 20 44 3 5 16 45 3 5 17 46 4 1 18 47 4 1 18 48 4 1 21 49 4 2 21 50 4 2 17 51 4 2 16 52 4 3 17 53 4 3 20 54 4 3 18 55 4 4 16 56 4 4 15 57 4 4 17 58 4 5 18 59 4 5 18 60 4 5 20