Zinc Data
Zinc Data. EPP 245 Statistical Analysis of Laboratory Data. . insheet using "Zinc.raw" (2 vars, 91 obs) . do "zinc.do" . regress peakarea concentration Source | SS df MS Number of obs = 91


Zinc Data
E N D
Presentation Transcript
Zinc Data EPP 245 Statistical Analysis of Laboratory Data
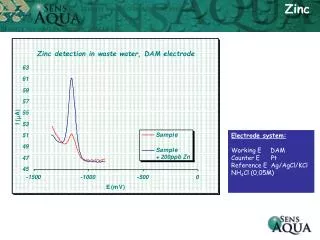
. insheet using "Zinc.raw" (2 vars, 91 obs) . do "zinc.do" . regress peakarea concentration Source | SS df MS Number of obs = 91 -------------+------------------------------ F( 1, 89) =55116.45 Model | 2.6694e+11 1 2.6694e+11 Prob > F = 0.0000 Residual | 431037404 89 4843116.9 R-squared = 0.9984 -------------+------------------------------ Adj R-squared = 0.9984 Total | 2.6737e+11 90 2.9707e+09 Root MSE = 2200.7 ------------------------------------------------------------------------------ peakarea | Coef. Std. Err. t P>|t| [95% Conf. Interval] -------------+---------------------------------------------------------------- concentrat~n | 7.207967 .0307024 234.77 0.000 7.146962 7.268972 _cons | 104.5429 267.137 0.39 0.696 -426.2527 635.3385 ------------------------------------------------------------------------------ . scatter peakarea concentration || lfit peakarea concentration . graph export zinc1.wmf, replace . rvfplot . graph export zinc2.wmf, replace . display (1850-_b[_cons])/_b[concentration] 242.15664 EPP 245 Statistical Analysis of Laboratory Data
. keep if concentration == 0 (83 observations deleted) . list concentration peakarea +---------------------+ | concen~n peakarea | |---------------------| 1. | 0 115 | 2. | 0 631 | 3. | 0 508 | 4. | 0 317 | 5. | 0 220 | |---------------------| 6. | 0 93 | 7. | 0 99 | 8. | 0 135 | +---------------------+ . summarize peakarea Variable | Obs Mean Std. Dev. Min Max -------------+-------------------------------------------------------- peakarea | 8 264.75 205.0343 93 631 . display 264.75 + 3*205.03 879.84 . EPP 245 Statistical Analysis of Laboratory Data