Zinc Data
Zinc Data. SPH 247 Statistical Analysis of Laboratory Data. zinc <- read.delim ("zinc.txt ") > names(zinc) [1] "Concentration" " Peak.Area " > zinc.lm <- lm( Peak.Area ~ Concentration,data =zinc) > summary( zinc.lm ) Call:

Zinc Data
E N D
Presentation Transcript
Zinc Data SPH 247 Statistical Analysis of Laboratory Data
zinc <- read.delim("zinc.txt") > names(zinc) [1] "Concentration" "Peak.Area" > zinc.lm <- lm(Peak.Area ~ Concentration,data=zinc) > summary(zinc.lm) Call: lm(formula = Peak.Area ~ Concentration, data = zinc) Residuals: Min 1Q Median 3Q Max -11242.22 -82.01 333.28 485.89 9353.28 Coefficients: Estimate Std. Error t value Pr(>|t|) (Intercept) 104.5429 267.1370 0.391 0.696 Concentration 7.2080 0.0307 234.769 <2e-16 *** --- Signif. codes: 0 ‘***’ 0.001 ‘**’ 0.01 ‘*’ 0.05 ‘.’ 0.1 ‘ ’ 1 Residual standard error: 2201 on 89 degrees of freedom Multiple R-squared: 0.9984, Adjusted R-squared: 0.9984 F-statistic: 5.512e+04 on 1 and 89 DF, p-value: < 2.2e-16 > plot(zinc$Concentration,zinc$Peak.Area) > abline(coef(zinc.lm)) > plot(fitted(zinc.lm),resid(zinc.lm)) > (1850-104.5429)/7.2080 [1] 242.1555 SPH 247 Statistical Analysis of Laboratory Data
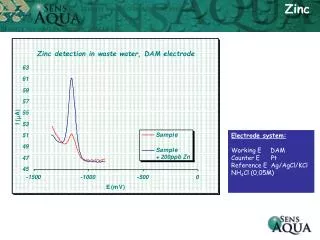
> zinc[zinc$Concentration==0,] Concentration Peak.Area 1 0 115 2 0 631 3 0 508 4 0 317 5 0 220 6 0 93 7 0 99 8 0 135 > mean(zinc[zinc$Concentration==0,2]) [1] 264.75 > sd(zinc[zinc$Concentration==0,2]) [1] 205.0343 > 264.75+3*205.03 [1] 879.84 SPH 247 Statistical Analysis of Laboratory Data