
Uploaded by
matthew-robles
12 SLIDES
246 VUES
120LIKES
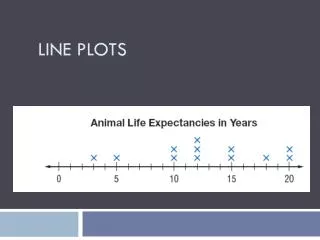
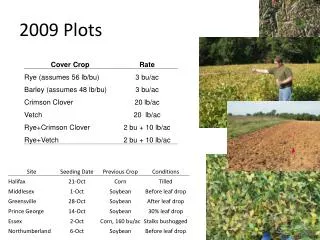
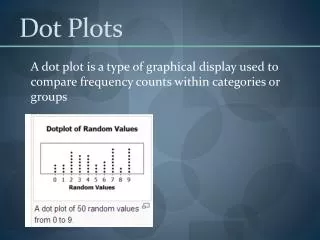
Analysis of Graphical Data Representations in Plots and Figures
DESCRIPTION
This document provides a comprehensive overview of various plots and figures from different datasets. It highlights the analysis of Figures 1, 2, and 3, showcasing key trends and patterns observed across the data visualizations. The focus is on how these visual aids enhance data interpretation, allowing for better communication of complex information. The context of these figures from the date of April 15, 2010, serves as a reference point for the evolution of data visualization techniques and methodologies in recent years.
Download

1 / 12
Télécharger la présentation 
Analysis of Graphical Data Representations in Plots and Figures
An Image/Link below is provided (as is) to download presentation
Download Policy: Content on the Website is provided to you AS IS for your information and personal use and may not be sold / licensed / shared on other websites without getting consent from its author.
Content is provided to you AS IS for your information and personal use only.
Download presentation by click this link.
While downloading, if for some reason you are not able to download a presentation, the publisher may have deleted the file from their server.
During download, if you can't get a presentation, the file might be deleted by the publisher.
E N D


More Related