Crop Compare - 2011
260 likes | 279 Vues
Find out which crops to grow in 2011 based on rotation, price and market outlook, marketing issues, machinery needs, profitability, risk, and return over variable costs. Use the Crop Compare tool to calculate the cash price needed for other crops to yield the same return over variable costs as the base crop.

Crop Compare - 2011
E N D
Presentation Transcript
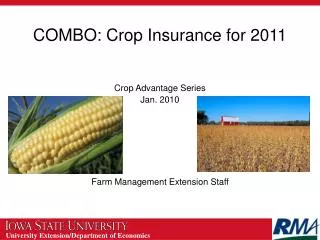
Crop Compare - 2011 Dwight Aakre Farm Management Specialist January 2011
Which Crops to Grow in 2011? • Rotation • Price and market outlook • Marketing issues • Machinery needs • Profitability • Risk • Return over variable costs
Cost of Production Index 1990 - 92 = 100
Change in Selected Input Prices • Seed unchanged to up 30% • Fertilizer up 40-75% • Chemicals flat (on average) • Fuel up 20% • Repairs up 5% • Crop insurance up 25-75% • Rent up
Crop Compare (an Excel spreadsheet) available to download at:http://www.ag.ndsu.edu/farmmanagement
Objective • The objective of “crop compare” is to calculate the cash price needed for other crops to yield the same return over variable costs as the base crop
User Input • All yields • All variable costs • Futures price and basis for base crop
Shortcoming of Crop Compare • Fixed costs are not included • Machinery ownership • Owner/operator labor • Differences in management and risk are not included
Adjustments for Fixed Costs: • Machinery • Storage • Labor • Management • Risk