Water Supply Analysis
Water Supply Analysis. Lindsay Carr, Joey Kleiner , Kinsey Hoffman June 4, 2014. 7Q10. 7Q10. Consider 1 year of flow data Average over 7 consecutive days. a verage 7 day annual low flow with a 10 year return period. Consider the 7 day averages

Water Supply Analysis
E N D
Presentation Transcript
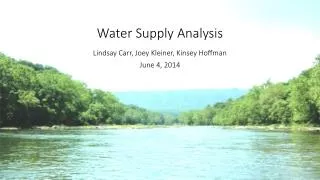
Water Supply Analysis Lindsay Carr, Joey Kleiner, Kinsey Hoffman June 4, 2014
7Q10 Consider 1 year of flow data Average over 7 consecutive days average 7 day annual low flow with a 10 year return period Consider the 7 day averages Take the lowest 7-day average for each year Consider lowest flows for every year Find annual low flow with a chance of occurring once every 10 years
Importance in Water Supply Management • Describes characteristics of a watershed • Often used to regulate withdrawals • Amount of flow needed for water quality standards • Amount of flow needed for habitat stability
Calculation Methods and Tools DFLOW • EPA’s program for determining 7Q10 values Matlab • Adapted a version from the University of Georgia R • Converted to R language from our Matlab version Log-Pearson Type III Distribution
Log-Pearson Type III Distribution Type of curve fitting for a frequency distribution common to hydrology
Log-Pearson Type III Distribution Type of curve fitting for a frequency distribution common to hydrology DFLOW: Simplified version of the Log-Pearson III calculation within the program Matlab: Calculates Log-Pearson III using multiple steps in the code R: Uses a Log-Pearson III function within the code
DFLOW Interface Add historic data Specify flow averaging period Specify the return period Then calculate
DFLOW Constraints • Requires user to download files from WOOOMM • Find specific segment in WOOOMM • Export flow data as a text file • User must alter the text file before importing to DFLOW • Header/footer of the exported results must be deleted • Only a few segments can be calculated at a time • Gives more than just 7Q10 value • Once calculated, users must separate the 7Q10 values from the other calculations in the resulting table
Matlab Code Automatically enters login information to access WOOOMM Specify query types within code rather than on WOOOMM Accesses data online rather than having to manually save it as a .txt file Builds WOOOMM url to access data based on specified parameters
R Code Can do multiple runs and segments at a time Specify query types within code Build url to access data automatically
Matlab and R Advantages • Automated data entry from WOOOMM • Only a few specifications before running the code • Results are automatically saved and returned to the WOOOMM database • More detailed Log-Pearson Type III distribution is used • Multiple segments and runs can be done all at the same time Matlab
Current Work – Handling Zeroes Large sections of 0.0 cfs values in the flow data 7 day average of 0.0 cfs Annual low flow of 0.0 cfs log ( 0 ) = undefined
Current Work – Handling Zeroes Conditional distribution – all values must remain non-zero 1. Mean (x̄) and standard deviation (S) is calculated with all non-zero values 2. Frequency factor, K, is adjusted Unconditional distribution – accounts for zero flows
Current Work – Handling Zeroes Vector without zeroes mean & standard deviation without zeroes adjusted p z with adjusted p
IFIM: Instream Flow Incremental Methodology • The goal of an IFIM study is to show the relationship between stream flows and available aquatic habitat • This Flow:Habitat relationship is necessary for assessing potential downstream impacts on habitat resulting from upstream flow alterations • A main product of an IFIM study is the Weighted Usable Area (WUA) table- an index showing habitat suitability for a given species over a range of flows
Steps in the IFIM Process • Habitat identification • Transect selection • Species selection, habitat suitability criteria (HSC) compilation • Collection of field hydraulic and habitat data • Physical Habitat Simulation System (PHABSIM) model • PHABSIM output of “Weighted Usable Area” (WUA)
The Formation of Fish Habitat • Fish habitat is dependent on: • Depth • Velocity • River bottom conditions (substrate/cover) • Depth and velocity conditions change with increasing flow • Example: Riffles, runs, pools
The Mapping of Fish Habitat • The first step in an IFIM study is the identification of aquatic habitats within the study area • The stream is divided into “study reaches” at points where significant changes in channel morphology or flow occur • The primary types of mesohabitats within these reaches need to be identified to facilitate transect site selection
The Mapping of Fish Habitat (cont.) • Habitat mapping is achieved through the use of existing institutional knowledge, aerial photographs, GIS, GPS, and site-specific data obtained through “float trips”
Transect Locations • Once the river reaches and habitat types are identified and mapped, transect locations for the collection of field hydraulic data are determined • Transects are located in areas representative of the hydraulic/habitat conditions observed in that reach
Field Data Collection • Physical Habitat Simulation (PHABSIM) software is used to simulate the relationship between streamflow and habitat for various species and life stages of fish • Data collected in the field at each transect location is used to calibrate PHABSIM for the study reach of interest • Data is collected at sampling stations/cells equally spaced along each transect • Data collected at each cell include: • Water surface elevation (WSE) • Water velocity • Substrate/cover
Field Data Collection (Cont.) • WSE and velocity data are typically collected at each transect under 3 different “target flows” (low flow, medium flow, high flow) • The target flows observed at the transects are achieved by altering dam releases upstream • Example of target flows: 50, 150, and 300 cfs (measured by a USGS gage within the study reach) • By entering the measurements taken at 3 flows, PHABSIM is able to interpolate WSE and velocity values for flows other than the 3 observed in the field
Field Data Collection (Cont.) • Cover/substrate measurements are taken during the lowest target flow • Codes for cover/substrate are assigned to each cell along a transect
Species Selection and HSC • A set of fish species needs to be selected for Flow:Habitat analysis • The species selected must be present within the study reach • The species chosen are usually the ones most affected by changes in flow • Each species has corresponding Habitat Suitability Criteria (HSC) that can be gathered from existing sources • HSC quantify habitat quality for each species/life stage based on flow velocity, depth of the water column and substrate/cover • HSC utilize a preference index ranging from 0 (least preferred) to 1 (most preferred)
PHABSIM Development • A hydraulic model within PHABSIM is created for each study transect • The hydraulic model consists of a water surface model and a velocity model • The water surface and velocity models are developed and calibrated using the 3 data sets obtained in the field (1 data set from each of the 3 target flows) • The calibrated hydraulic model is able to simulate WSE and velocity values at each cell along the transect for any flow value • The hydraulic model at each transect is combined with the HSC to produce a WUA table showing the Flow:Habitatrelationship at that transect
PHABSIM Development (Cont.) • HSC for water depths, water velocities and substrate/cover are used to rank the suitability of each model cell in a transect • This uses a multiplicative approach where suitability indexes (on a scale from 0.0 to 1.0) for a single cell in a transect are multiplied together (depth*velocity*substrate) to produce a composite suitability score for that cell (0.0 to 1.0) • The suitability score of a cell is used to weight the area of that cell to produce a “Weighted usable area” (WUA) value for that cell • The weighted values for all cells in a transect are summed to produce a total WUA for that transect WUA = suitability-weighted samples of area • WUA is an index to the microhabitat availability
WUA Development within PHABSIM • By repeating this process for multiple species/lifestages over an entire range of flows, a WUA table can be produced for each transect displaying the flow:habitat relationship for each species/lifestage of interest • The WUA tables from each transect in a reach can be averaged together using weighting factors to produce a single WUA table representative of the entire reach • WUA tables from each transect are weighted so that each transect's contribution to the reach-WUA is indicative of the amount of each habitat type (% area) present in the reach • Area weighting factors are determined during the development of the habitat maps
WUA Development within PHABSIM (Cont.) • Weighting transect-WUAs to produce a single reach-WUA table: % of each habitat type present in a single reach Weighting factors for each transect in the reach
Habitat Peaks (WUA) • Determine flow values at peak WUA values Median Flow at Habitat Peaks Minimum Flow at Habitat Peaks Maximum Flow at Habitat Peaks
August Low Flow (ALF) • Median of the minimum flows on record in month of August • Used more for biological purposes • Is there enough water for necessary biological functions in this late summer time period? • Calculated with R, stored in WOOOMM • WOOOMM Comparison Link Calculate median of the minimum flows
Percentile Flows • Percent non-exceedance flows over a long period of recorded flow data • Ex: Flow on any given day is less than the long-term median flow (50th percentile) only 50% of the time on record • USGS calculates stats for their long-term gages • We can also calculate in WOOOMM looking at August flow statistics
Flow Statistics Analysis Table • Compare August Low Flow, percentile flows, and flows at habitat peaks for existing IFIM studies • See where flows at habitat peaks fall in relation to August Low Flow and certain percentile flows
Old Science of Flow-Habitat Relationship • Observe changes in flow regime and habitat structure • Flow regime: discharge, depth, velocity, flood frequency/magnitude, drought frequency/magnitude • Habitat structure: biodiversity, bank stability, streambed cover, riparian vegetation • Create X-Y plot that shows how habitat varies with flow (IFIM & WUA) HABITAT FLOW Bovee et. al, 1998
Transition to Flow-Ecology • Historically, find a single flow to maximize microhabitat for a life stage of high-profile fish species • Now widely accepted that a naturally variable regime of flow, rather than just a single flow, is required to sustain freshwater ecosystems • Natural flow regime = range and variation of flows over recent historical time • No single flow value will conserve an ecosystem, or is optimal for all organisms and life cycles Bovee et. al, 1998; Poff, 2010; Ahmadi-Nedushan et. al, 2006; Poff and Zimmerman, 2010
New Science of Flow-Ecology Relationship • Dubbed “flow alteration-ecological response relationships” • Relate measures of ecological condition to metrics of flow alteration • Ecological indicators: fish, macroinvertebrates, algae and vegetation, riparian vegetation, wildlife, organic matter, nutrients, sediment • Indicators of Hydrologic Alteration (IHA): 7Q10, August low flow, number of flood flow events, etc. • Assess how flow regimes have been affected by human activities over time observe how ecosystem responds Poff et. al, 2010;
Examples of Flow-Ecology Month in which 7-day Min Occurs • Flow Analysis table • Comparison of flow metrics • Percent changes in flow metrics • When 7-day minimum flow occurs Percent Change in 7Q10 Sept. Drought Warning 7Q10 August Low Flow
Implications of Flow-Ecology Strengths Weaknesses Rely too much on assumptions between flow-ecology connections? Are changes in flow regimes (and thus changes in ecology) natural or anthropogenic? • Ecological condition can be difficult to manage directly, but streamflow conditions can be managed through water-use strategies and policies • Use flow metrics as surrogate to collecting habitat data • Expensive, time-consuming Ahmadi-Nedushan et. al, 2006