Download
1 / 15
150 likes | 244 Vues
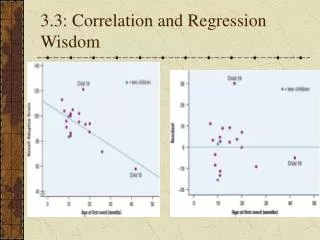
Analyzing the relationship between SAT scores and GPA to determine academic performance predictability in universities. Learn to calculate correlation, regression line, and interpret scatter plots for effective assessment.

E N D
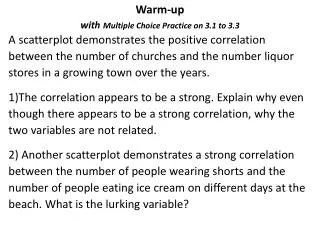
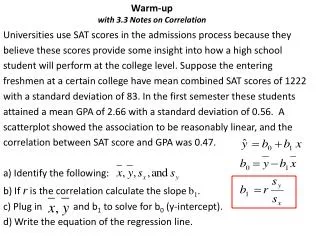
Warm-upwith 3.3 Notes on Correlation Universities use SAT scores in the admissions process because they believe these scores provide some insight into how a high school student will perform at the college level. Suppose the entering freshmen at a certain college have mean combined SAT scores of 1222 with a standard deviation of 83. In the first semester these students attained a mean GPA of 2.66 with a standard deviation of 0.56. A scatterplot showed the association to be reasonably linear, and the correlation between SAT score and GPA was 0.47. a) Identify the following: b) If r is the correlation calculate the slope b1. c) Plug in and b1 to solve for b0 (y-intercept). d) Write the equation of the regression line.
Calculating the LSRL step-by-step A high school counselor wants to see if there is a correlation between GPA and SAT score. Here are some of the data the guidance counselor is looking at. Sum: _____ _____ _____ ______ _______ _______ Mean: ____ _____ _____ _____ to find the bo substitute ( )
Use the calculator to find the LSRL STAT = > CALC Select #8 LinReg(a + bx) To get correlation go to 2nd 0 for Catalog hit x-1for D. Find DiagonsticOn highlight it and hit ENTER two times.
3.3 Correlation Correlation tells you the strength of the trend. OR r2 is the coefficient of determination. It is the proportion of variation of the response variable that can be explained by the explanatory variable.
How to see the residual plot on the calculator! If the regression line is a good model, we would expect to find the residuals more or less randomly scattered about the average residual which is represented by the horizontal line. No pattern on the residual plot means the data could be represented by a linear model.
Finding Correlation Coefficient on the Calculator • In order to find r (correlation coefficient) on your calculator. • We need to change it from the factory setting by going to CATALOG (Hit 2nd the 0 zero). • When in CATALOG your keys are automatically in Alpha so hit x-1 (where the Green D is located) • Scroll down to DiagnosticOn and press Enter twice! Practice: Speed: 20 30 40 50 60 MPG: 24 28 30 28 24 STAT -> Calc Scroll down to 8: LinReg(a+bx) Enter LineReg(a +bx) L1, L2, Y1 Enter Notice you get both r and r2! Any theories about the r in this problem? Look at the graph.
Investigation ofScatter plots and Residuals Any observations on the two Data Sets? Remember to use Zoom #9 Zoom Stat Each time. Homework 3.3 Pg 141 P#15 and 16, E#27 and 28
Ch. 1 Test • Double-checked, 12# on FORM A, if you answered C, you got it right. My answer key was wrong. • Bring me your test if your original answer was A on #12 if you had FORM A.
Monday is 3.1 to 3.3 Quiz • Know all vocabulary and formulas from 3.1 to 3.3 • Know how create a scatter plot and find the Line of best fit. • Know how to calculate the LSRL, how to extrapolate and calculate the residual for a particular piece of data. • Be able to interpret the slope and y-intercept in the context of the problem • Know how to describe scatter plots: Shape, Trend Strength and under Shape: Linearity, Clusters and outlier. • Know how to calculate the SSE
Answers to A.P. Statistics H.W. 3.2 P#3 and 4, E # 9 and 11 P4. a. The slope is about 0.8 b. This means as hand length increases by 1 cm, the width would increase by 0.8 cm. c. d. A possible explanation is that the points represent those students that measured hand width by not spreading fingers apart. If the cluster of points below was removed then the slope becomes steeper. P5.