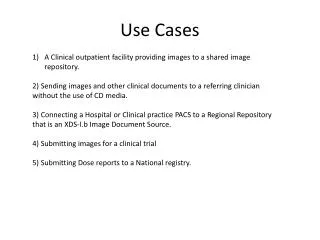
Use cases
Explore navigation possibilities, access data hierarchies, and perform problem analysis in IT systems efficiently, with a focus on alerts, notifications, and troubleshooting processes.

Use cases
E N D
Presentation Transcript
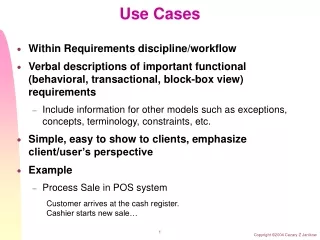
Use cases Navigation Problem notification Problem analysis
Navigation • Navigations - Actions of finding specific data in the information system • Efficient navigation and switching to relevant pages, following the logical analysis and troubleshooting process • Navigation possibilities • Browsing of the data hierarchy • Search • Access from the Graph • Access from the Group of Monitors • Access from Alerts and Event Log • Access from the Trace box • Browsing the network topology – Links box • Access from the Object Navigation Path • Access from the Recently Used list
Problem notification • email – text describes the problem Actions: • look at the RRD Chart • Navigate to parent Object (port, device) • Alerts– coloured in red Actions: • look at the RRD Chart • go to the Monitor • go to parent Port/Device • go to relevant Group
Problem notification • Monitors Overview Group– coloured in red Actions: • look at the adhering RRD Chart • check the status of other Monitors • go to the Monitor • go to parent Port/Device • go to relevant Group
Problem notification • Event log – coloured alert level Actions: • look at the adhering RRD Chart • check the occurrences of this event • go to the Monitor • go to parent Port/Device • go to relevant Group
Problem notification • Graph • weather map overview, "Explosion" – check the traffic • link status overview, red arrow – check the port status Actions: • if Port is marked with a red colour, double click the Port • Trace link - click on the link • check other RRD Charts • go to the nearest port in relation to the NetIIS server • identify the Location • go to the Monitor • go to parent Port/Device • go to relevant Group
Problem analysis • Common problems: • "Link failure" • "Link is up, BGP is down" • "BGP session is established, but there is no traffic" • "Packet loss" • "Increased packet rate''
Problem analysis • "Link failure" • Examine the global network status from the weather-map • Navigate to the interface details • Check the Port Monitor, the recent history on RRD Chart • Show all events on Event Page • Execute Looking Glass command show interface • Following the link, go to the remote router page, check the remote interface status if it is accessible through the backup-link (if such exists)
Problem analysis • "Link is up, BGP is down" • Navigate to the interface details • Analyse recent history for BGP status (RRD Chart, Event log) • Eexecute Looking Glass command show bgp summary • Investigate the link quality by examining the Ping Monitor, the Traffic Monitor and the Packet Monitor • Execute the Ping Monitor • Check the system uptime on both end routers (for possible reload) • Check the eventual intermediate points between the BGP peers (e.g. connection over MPLS).
Problem analysis • "BGP session is established, but there is no traffic" • Navigate to the interface details • Investigate the reachability and link quality by checking the Ping Monitor • Execute Ping Monitor, Looking Glass command ping and traceroute to other devices/sites • Analyse recent history for BGP status (RRD Chart, Event Log) • Execute Looking Glass command show bgp summary and examine the column with the total BGP entries number (number of routes) • Check the route table by Looking Glass command show ip route
Problem analysis • "Packet loss" • Navigate to the interface details • investigate the reachability and link quality through cross-checking with the Ping Monitor • Execute the ping Looking Glass command • Check the Traffic Monitor and the router utilization Monitors for possible link or router congestion • Research recent history for BGP status, execute command show bgp summary and search for possible BGP flapping • Examine the routes using the show ip route and traceroute Looking Glass commands for the remote address
Problem analysis • "Increased packet rate'‘ • Navigate to the interface details • Investigate Packet and Traffic Monitors • Check the link quality using the Ping Monitor • Execute the ping Looking Glass command • Check the router utilization Monitors for possible router congestion (as a consequence of the problem) • If a possible DDoS-attack is in progress, trace back the other interfaces investigating the Packet/Traffic Monitors and try to locate the source of traffic • Check NetFlow tools, if such are available
Use casesSummary Navigation Problem notification Problem analysis