Download
1 / 34
340 likes | 356 Vues
Explore the evolution of global population databases, related advancements, and proposed next steps for improved accuracy and data quality. Discover smart interpolation methods and access-based modeling to predict population density using auxiliary GIS data layers. Identify challenges and solutions in source data improvement, auxiliary data sets, and institutional coordination. Delve into user feedback, database expansion for time-series projections, demographic components, poverty indicators, and more.

E N D
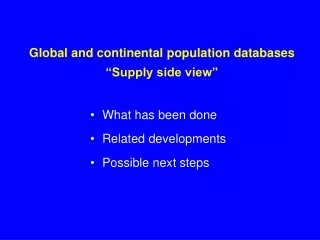
Global and continental population databases“Supply side view” • What has been done • Related developments • Possible next steps
Population data in raster format • Gridding pop data is not a new idea • Population map of West Africa (John Adams, LSE 1968) • Statistical Offices (e.g., Japan, Sweden) • Population Atlas of China • ... • Individual country or regional level • Methods not well-documented • Mostly not available in digital form
Continental / global data sets • BUCEN’s CIR database • Africa (UNEP/GRID, 1991) • Global Demography Project (NCGIA & CIESIN, 1994) • 1 degree global grid (Environment Canada, 1995) • Europe (RIVM, 1995) • Africa update and Asia (NCGIA, UNEP/GRID & WRI, 1996) • Latin America (CIAT) • Landscan (ORNL, 1999) • GPW II (CIESIN, 2000)
Continental / global data sets • Data collection focused • Cartographic models - pycnophylactic interpolation, dasymetric mapping • “Smart interpolation” • adjustment factorsbased on auxiliaryGIS data layers • accessibility basedweighting
Related developments - source data • Initial data sets and applications have created large demand for these types of data (gridded and small area data) • National statistical offices are adopting GIS for census mapping; in developing countries supported by UNSD and donors • Availability of national and regional high resolution and high quality databases; NSOs, CIESIN - China & Mexico, ACASIAN, MEGRIN
Related developments - modeling • Innovative modeling approaches • Kernel estimation • Fractal cities • Behavioral models (settlers) • NASA/USGS work on land cover change / urban growth patterns • ... • New global data sets that can support population modeling • USGS elevation and land cover data • NOAA “city lights” • WCMC protected areas • ...
Next steps • Accuracy assessment of existing data sets • User survey • who benefits from these data? • can we get better feedback from users? • do current data sets address expressed needs? • is it worth the cost?
Improve quality of source data • Largest quality improvements will come from better input data, not from modeling improvements • Collection of pop figures and boundary data is a never-ending task (e.g., 2000 round data available soon) • Improve base pop estimates - extrapolation to common base year, recent pop displacements • For boundaries: focus on highest possible resolution or on best possible positional accuracy? • Identify new and improve existing auxiliary data sets
Improve smart interpolation methods • Calibration of parameters! • currently determined ad hoc, but should be based on observed patterns (both accessibility and other auxiliary factors) • adjustment factors should be determined statistically • importance of factors unlikely to be constant across countries • accuracy assessment
Estimated population densities based on district level totals based on state level totals
Improve smart interpolation methods • Make more explicit use of city information • location and size of many cities available • urban extent approximated by “city lights” data • may address urban / rural issue better than official statistics
Resolve modeling issues • Potential circularity • e.g., for environmental applications, can’t use land cover data to predict pop distribution, if users will then cross-tabulate pop with land cover types • but for “pop at risk” studies (e.g., health, disaster response) we might want to use any available meaningful auxiliary factors • family of data sets?
Resolve modeling issues • What is an appropriate output resolution? • average GPW admin unit resolution is 33 km, average area is about 1070 sq. km • pixel size is 2.5 min, or about 4.6 km at equator with an area of about 21 sq. km • so “modeling ratio” is about 50 output cells per admin unit • but large variability across countries (resolution) • Switzerland 3.7 • Luxembourg 4.7 • … • Chad 302.8 • Saudi Arabia 374.2 • Same with population per unit (1.5 thousand to 3.4 million)
Resolve institutional issues • Coordination between groups • pool input data sources • agree on coding schemes (FAO proposal) • division of tasks • Get endorsement from National Statistical Offices and UN • Determine distribution status of admin boundaries • Funding plans
Expand scope of database • Time series / projections or scenarios • Rural / urban • Demographic components (age-sex) • Living standards • High resolution databases for specific regions/countries • Work closer with application projects
Clarke and Rhind 1991 • Variety of databases with different levels of spatial resolution • made compatible with gridded data • no more than a few years out of date • time series of data for different resolutions • ability to distribute freely for scientific purposes